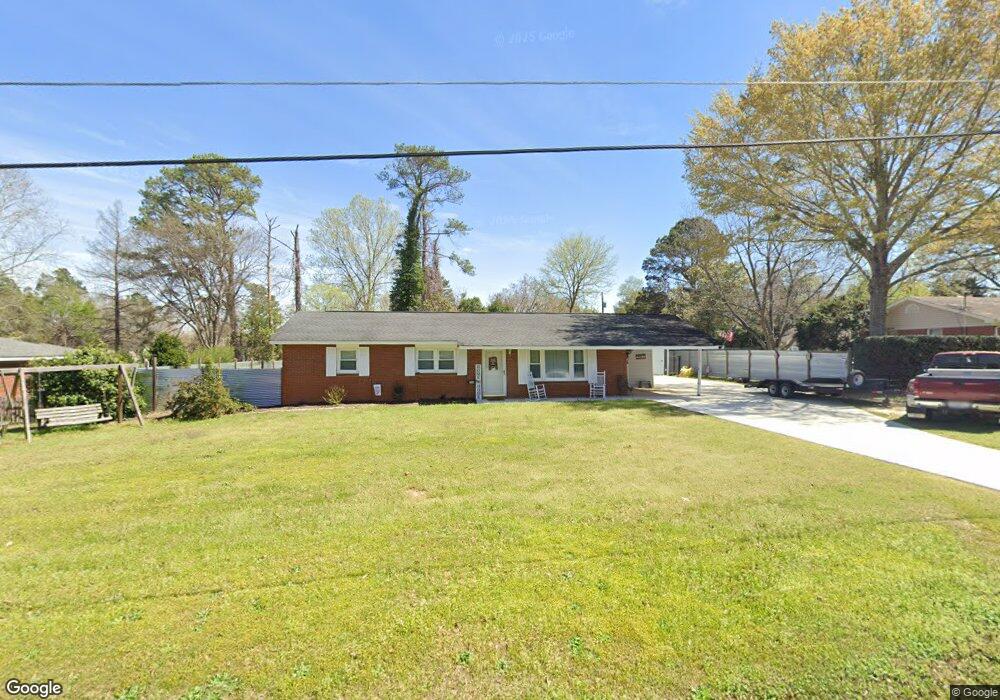
208 Fleming Dr Bonaire, GA 31005
Estimated Value: $146,232 - $184,000
--
Bed
2
Baths
1,248
Sq Ft
$135/Sq Ft
Est. Value
About This Home
This home is located at 208 Fleming Dr, Bonaire, GA 31005 and is currently estimated at $168,058, approximately $134 per square foot. 208 Fleming Dr is a home located in Houston County with nearby schools including Bonaire Elementary School, Huntington Middle School, and Warner Robins High School.
Ownership History
Date
Name
Owned For
Owner Type
Purchase Details
Closed on
Mar 20, 2000
Sold by
Johnson James A
Bought by
Johnson James A and Julia H*
Current Estimated Value
Purchase Details
Closed on
Mar 17, 2000
Sold by
Mosley Ralph J and Mosley Gwendolyn S
Bought by
Johnson James A
Purchase Details
Closed on
Mar 12, 1990
Sold by
Logan Kevin A and Ashley Byron J
Bought by
Mosley Ralph J and Mosley Gwendolyn S
Purchase Details
Closed on
Dec 14, 1981
Sold by
Logan Kevin A
Bought by
Logan Kevin A and Ashley Byron J
Purchase Details
Closed on
Oct 14, 1981
Sold by
Hogue Martin L
Bought by
Logan Kevin A
Purchase Details
Closed on
Sep 27, 1978
Sold by
Dudley Jack C
Bought by
Hogue Martin L
Purchase Details
Closed on
Nov 7, 1968
Sold by
Romubio Grace D
Bought by
Dudley Jack C
Purchase Details
Closed on
Oct 1, 1966
Sold by
Conner John R
Bought by
Romubio Grace D
Purchase Details
Closed on
Aug 23, 1966
Bought by
Conner John R
Create a Home Valuation Report for This Property
The Home Valuation Report is an in-depth analysis detailing your home's value as well as a comparison with similar homes in the area
Home Values in the Area
Average Home Value in this Area
Purchase History
| Date | Buyer | Sale Price | Title Company |
|---|---|---|---|
| Johnson James A | -- | -- | |
| Johnson James A | $64,900 | -- | |
| Mosley Ralph J | $45,000 | -- | |
| Logan Kevin A | -- | -- | |
| Logan Kevin A | -- | -- | |
| Hogue Martin L | -- | -- | |
| Dudley Jack C | -- | -- | |
| Dudley Jack C | -- | -- | |
| Romubio Grace D | -- | -- | |
| Conner John R | -- | -- |
Source: Public Records
Tax History Compared to Growth
Tax History
| Year | Tax Paid | Tax Assessment Tax Assessment Total Assessment is a certain percentage of the fair market value that is determined by local assessors to be the total taxable value of land and additions on the property. | Land | Improvement |
|---|---|---|---|---|
| 2024 | $876 | $36,640 | $5,880 | $30,760 |
| 2023 | $754 | $31,200 | $5,880 | $25,320 |
| 2022 | $701 | $29,000 | $5,880 | $23,120 |
| 2021 | $625 | $25,720 | $5,880 | $19,840 |
| 2020 | $623 | $25,520 | $5,880 | $19,640 |
| 2019 | $623 | $25,520 | $5,880 | $19,640 |
| 2018 | $623 | $25,520 | $5,880 | $19,640 |
| 2017 | $624 | $25,520 | $5,880 | $19,640 |
| 2016 | $624 | $25,520 | $5,880 | $19,640 |
| 2015 | $626 | $25,520 | $5,880 | $19,640 |
| 2014 | -- | $25,560 | $5,880 | $19,680 |
| 2013 | -- | $25,560 | $5,880 | $19,680 |
Source: Public Records
Map
Nearby Homes
- 307 Fleming Dr
- 0 Michael Ct Unit 10532063
- 0 Michael Ct Unit 179429
- 0 Michael Ct Unit 252716
- 114 Saint Augustine Dr
- 202 Sandy Run Rd
- 204 Thornton Dr
- 104 Old Perry Rd
- 108 Savannah Ln
- 109 Harmony Path
- 102 Harmony Path
- 106 Mulligan Ct
- 100 Deerwood Dr
- 305 Edgarton Way
- 107 Shadowood Dr
- 91 Stathams Way
- 315 Apalachee Way
- 503 Edgarton Way
- 210 Fleming Dr
- 210 Fleming Dr Unit 102 Fox Hall Blvd
- 206 Fleming Dr
- 209 Fleming Dr
- 204 Fleming Dr
- 211 Fleming Dr
- 211 Fleming
- 207 Fleming Dr
- 102 Fox Hall Blvd
- 300 Fleming Dr
- 0 Fleming Dr Unit 8777459
- 0 Fleming Dr Unit 8627336
- 0 Fleming Dr
- 301 Fleming Dr
- 205 Fleming Dr
- 202 Fleming Dr
- 110 Michael St
- 0 Michael St Unit 7197870
- 0 Michael St Unit 7104421
- 302 Fleming Dr