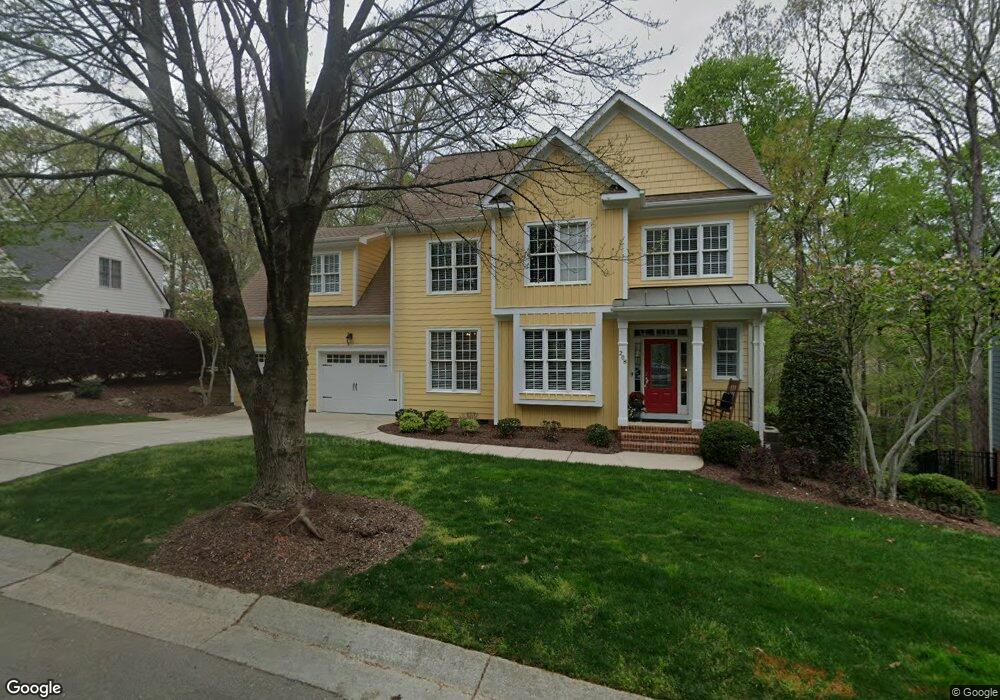
208 Flint Point Ln Holly Springs, NC 27540
Estimated Value: $706,815 - $758,000
4
Beds
3
Baths
2,573
Sq Ft
$285/Sq Ft
Est. Value
About This Home
This home is located at 208 Flint Point Ln, Holly Springs, NC 27540 and is currently estimated at $733,954, approximately $285 per square foot. 208 Flint Point Ln is a home located in Wake County with nearby schools including Holly Springs Elementary School, Holly Ridge Middle School, and Holly Springs High School.
Ownership History
Date
Name
Owned For
Owner Type
Purchase Details
Closed on
Apr 24, 2013
Sold by
Nechvatal Joanna A and Nechvatal Samuel C
Bought by
Hoggard Brian S and Hoggard Katie A
Current Estimated Value
Home Financials for this Owner
Home Financials are based on the most recent Mortgage that was taken out on this home.
Original Mortgage
$300,162
Outstanding Balance
$209,749
Interest Rate
3.25%
Mortgage Type
FHA
Estimated Equity
$524,205
Purchase Details
Closed on
Apr 19, 2005
Sold by
Pinkus Construction Inc
Bought by
Nechvatal Samuel C and Nechvatal Joanna A
Home Financials for this Owner
Home Financials are based on the most recent Mortgage that was taken out on this home.
Original Mortgage
$244,000
Interest Rate
5.88%
Mortgage Type
Fannie Mae Freddie Mac
Create a Home Valuation Report for This Property
The Home Valuation Report is an in-depth analysis detailing your home's value as well as a comparison with similar homes in the area
Home Values in the Area
Average Home Value in this Area
Purchase History
| Date | Buyer | Sale Price | Title Company |
|---|---|---|---|
| Hoggard Brian S | $314,000 | None Available | |
| Nechvatal Samuel C | $306,000 | -- |
Source: Public Records
Mortgage History
| Date | Status | Borrower | Loan Amount |
|---|---|---|---|
| Open | Hoggard Brian S | $300,162 | |
| Previous Owner | Nechvatal Samuel C | $244,000 | |
| Closed | Nechvatal Samuel C | $30,500 |
Source: Public Records
Tax History Compared to Growth
Tax History
| Year | Tax Paid | Tax Assessment Tax Assessment Total Assessment is a certain percentage of the fair market value that is determined by local assessors to be the total taxable value of land and additions on the property. | Land | Improvement |
|---|---|---|---|---|
| 2025 | $5,966 | $690,918 | $150,000 | $540,918 |
| 2024 | $5,941 | $690,918 | $150,000 | $540,918 |
| 2023 | $4,672 | $431,320 | $78,000 | $353,320 |
| 2022 | $4,497 | $430,029 | $78,000 | $352,029 |
| 2021 | $4,149 | $404,129 | $78,000 | $326,129 |
| 2020 | $4,149 | $404,129 | $78,000 | $326,129 |
| 2019 | $3,915 | $323,695 | $78,000 | $245,695 |
| 2018 | $3,538 | $323,695 | $78,000 | $245,695 |
| 2017 | $3,411 | $323,695 | $78,000 | $245,695 |
| 2016 | $3,364 | $323,695 | $78,000 | $245,695 |
| 2015 | $3,688 | $349,488 | $78,000 | $271,488 |
| 2014 | -- | $349,488 | $78,000 | $271,488 |
Source: Public Records
Map
Nearby Homes
- 112 Midden Way
- 228 Masden Rd
- 204 Chrismill Ln
- 225 Old Ride Dr
- 0 Old Ride Dr
- 208 Old Ride Dr
- 217 Jones Hill Rd
- 108 Warm Wood Ln
- 204 Crossway Ln
- 129 Starwood Ln
- 0/416 Holly Springs Rd
- 413 Rhamkatte Rd
- 208 Apple Drupe Way
- 215 Savannah Ridge Rd Unit 215
- 229 Amacord Way
- 305 Savannah Ridge Rd
- 116 Cobblebrook Ct
- 401 Wellspring Dr
- 305 Wellspring Dr
- 109 Willow View Ln
- 212 Flint Point Ln
- 701 Crossway Ln
- 200 Flint Point Ln
- 205 Flint Point Ln
- 216 Flint Point Ln
- 209 Flint Point Ln
- 705 Crossway Ln
- 201 Flint Point Ln
- 204 Midden Way
- 116 Midden Way
- 140 Flint Point Ln
- 208 Midden Way
- 300 Flint Point Ln
- 617 Crossway Ln
- 709 Crossway Ln
- 704 Crossway Ln
- 125 Cliffcreek Dr
- 129 Flint Point Ln
- 301 Flint Point Ln
- 136 Flint Point Ln