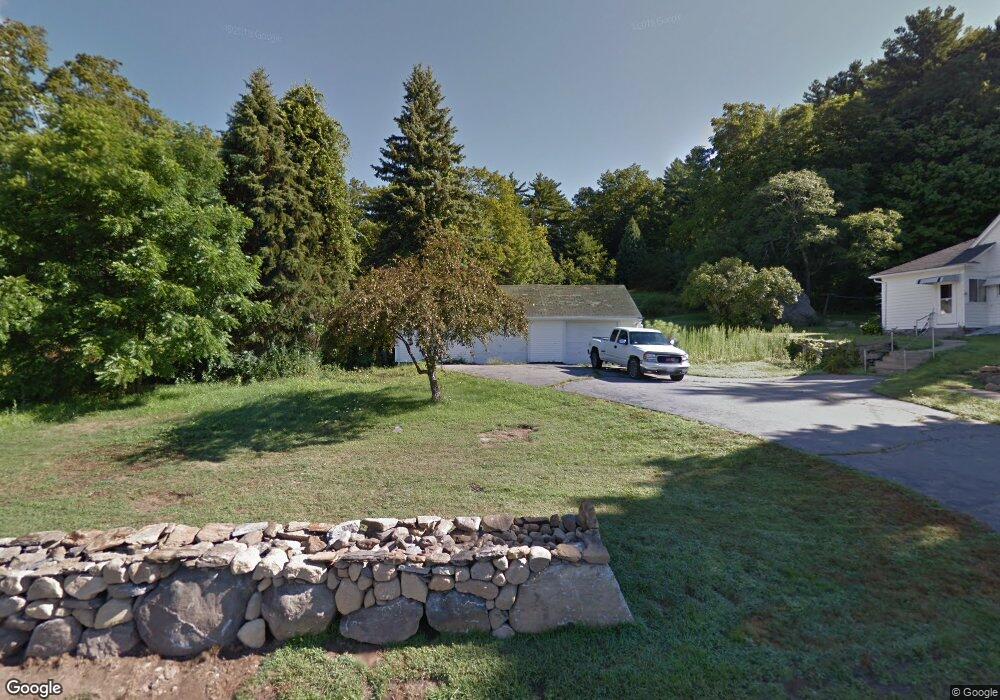
208 Green St Northborough, MA 01532
Estimated Value: $536,000 - $2,995,492
2
Beds
2
Baths
1,675
Sq Ft
$744/Sq Ft
Est. Value
About This Home
This home is located at 208 Green St, Northborough, MA 01532 and is currently estimated at $1,246,123, approximately $743 per square foot. 208 Green St is a home located in Worcester County with nearby schools including Lincoln Street Elementary School, Robert E. Melican Middle School, and Algonquin Regional High School.
Ownership History
Date
Name
Owned For
Owner Type
Purchase Details
Closed on
Oct 25, 2013
Sold by
Schunder Harry J and Schunder Katherine
Bought by
Schunder John R and Schunder Katherine
Current Estimated Value
Purchase Details
Closed on
Feb 17, 2012
Sold by
Schunder John R and Schunder Harry J
Bought by
Northborough Town Of
Purchase Details
Closed on
Mar 4, 2010
Sold by
Schunder Tr John R and Schunder Harry J
Bought by
Schunder John R
Purchase Details
Closed on
Sep 9, 2008
Sold by
Harriet H Schunder T and Russell Francis J
Bought by
Schunder Harry J and Schunder John R
Create a Home Valuation Report for This Property
The Home Valuation Report is an in-depth analysis detailing your home's value as well as a comparison with similar homes in the area
Home Values in the Area
Average Home Value in this Area
Purchase History
| Date | Buyer | Sale Price | Title Company |
|---|---|---|---|
| Schunder John R | $105,000 | -- | |
| Schunder John R | $105,000 | -- | |
| Northborough Town Of | $1,240,000 | -- | |
| Schunder John R | -- | -- | |
| Schunder Harry J | -- | -- | |
| Schunder Harry J | -- | -- |
Source: Public Records
Tax History Compared to Growth
Tax History
| Year | Tax Paid | Tax Assessment Tax Assessment Total Assessment is a certain percentage of the fair market value that is determined by local assessors to be the total taxable value of land and additions on the property. | Land | Improvement |
|---|---|---|---|---|
| 2025 | $7,600 | $533,300 | $299,700 | $233,600 |
| 2024 | $6,740 | $472,000 | $244,600 | $227,400 |
| 2023 | $6,858 | $463,700 | $231,800 | $231,900 |
| 2022 | $6,766 | $410,300 | $221,400 | $188,900 |
| 2021 | $3,604 | $379,000 | $202,600 | $176,400 |
| 2020 | $6,498 | $376,700 | $202,600 | $174,100 |
| 2019 | $6,011 | $350,500 | $197,000 | $153,500 |
| 2018 | $5,629 | $323,700 | $180,400 | $143,300 |
| 2017 | $5,380 | $309,400 | $180,400 | $129,000 |
| 2016 | $5,156 | $300,300 | $176,800 | $123,500 |
| 2015 | $5,126 | $306,400 | $184,100 | $122,300 |
| 2014 | $4,937 | $297,600 | $184,100 | $113,500 |
Source: Public Records
Map
Nearby Homes