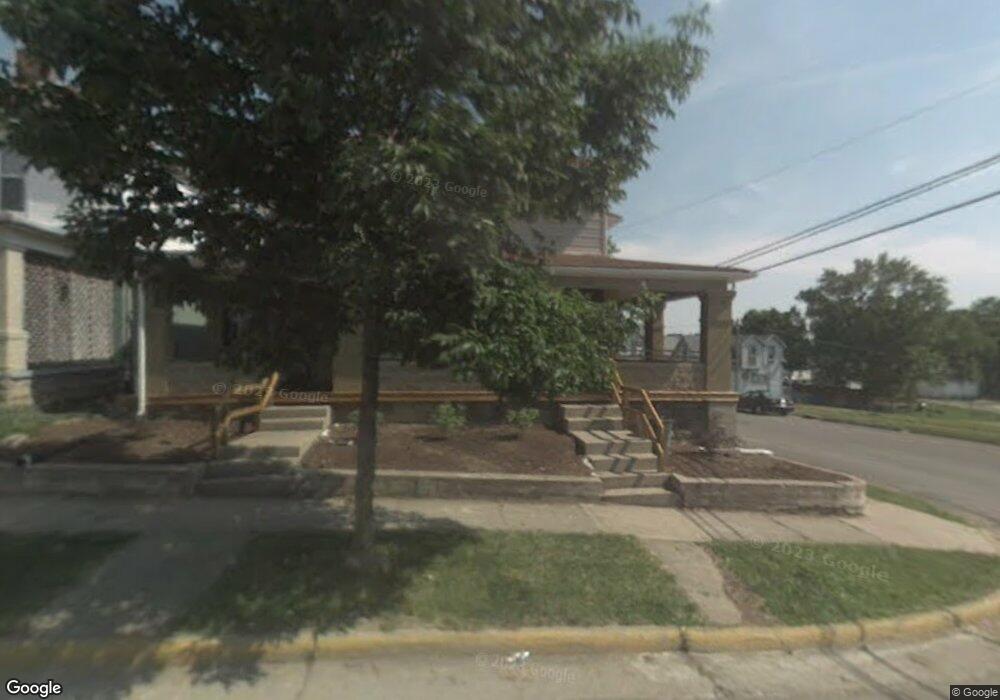
208 Grove St Unit 210 Sidney, OH 45365
Estimated Value: $97,000 - $131,000
6
Beds
2
Baths
2,944
Sq Ft
$39/Sq Ft
Est. Value
About This Home
This home is located at 208 Grove St Unit 210, Sidney, OH 45365 and is currently estimated at $114,956, approximately $39 per square foot. 208 Grove St Unit 210 is a home located in Shelby County with nearby schools including Sidney High School, Holy Angels Catholic School, and Christian Academy Schools.
Ownership History
Date
Name
Owned For
Owner Type
Purchase Details
Closed on
Nov 5, 2024
Sold by
H & H Assets Llc
Bought by
Schwieterman Rentals Llc
Current Estimated Value
Purchase Details
Closed on
Dec 13, 2021
Sold by
Malott Leatha and Schutte Leatha
Bought by
H & H Assets Llc
Home Financials for this Owner
Home Financials are based on the most recent Mortgage that was taken out on this home.
Original Mortgage
$56,000
Interest Rate
2.35%
Mortgage Type
Future Advance Clause Open End Mortgage
Purchase Details
Closed on
Oct 27, 2008
Sold by
Schutte Leatha
Bought by
Schutte Leatha
Purchase Details
Closed on
Jun 26, 2001
Sold by
Huley Stephen
Bought by
Edwards Gerald
Purchase Details
Closed on
Oct 5, 1999
Sold by
Asher Merrill
Bought by
Hurley Steven D
Home Financials for this Owner
Home Financials are based on the most recent Mortgage that was taken out on this home.
Original Mortgage
$48,952
Interest Rate
7.93%
Mortgage Type
New Conventional
Create a Home Valuation Report for This Property
The Home Valuation Report is an in-depth analysis detailing your home's value as well as a comparison with similar homes in the area
Home Values in the Area
Average Home Value in this Area
Purchase History
| Date | Buyer | Sale Price | Title Company |
|---|---|---|---|
| Schwieterman Rentals Llc | $348,000 | None Listed On Document | |
| Schwieterman Rentals Llc | $348,000 | None Listed On Document | |
| H & H Assets Llc | $70,000 | None Available | |
| Schutte Leatha | $22,000 | Attorney | |
| Edwards Gerald | $62,000 | -- | |
| Hurley Steven D | $58,000 | -- |
Source: Public Records
Mortgage History
| Date | Status | Borrower | Loan Amount |
|---|---|---|---|
| Previous Owner | H & H Assets Llc | $56,000 | |
| Previous Owner | Hurley Steven D | $48,952 |
Source: Public Records
Tax History Compared to Growth
Tax History
| Year | Tax Paid | Tax Assessment Tax Assessment Total Assessment is a certain percentage of the fair market value that is determined by local assessors to be the total taxable value of land and additions on the property. | Land | Improvement |
|---|---|---|---|---|
| 2024 | $1,356 | $37,720 | $4,460 | $33,260 |
| 2023 | $1,368 | $37,720 | $4,460 | $33,260 |
| 2022 | $1,350 | $32,990 | $3,620 | $29,370 |
| 2021 | $1,364 | $32,990 | $3,620 | $29,370 |
| 2020 | $1,364 | $32,990 | $3,620 | $29,370 |
| 2019 | $1,246 | $30,250 | $3,060 | $27,190 |
| 2018 | $1,229 | $30,250 | $3,060 | $27,190 |
| 2017 | $1,222 | $30,250 | $3,060 | $27,190 |
| 2016 | $1,200 | $29,640 | $3,060 | $26,580 |
| 2015 | $1,149 | $28,310 | $3,060 | $25,250 |
| 2014 | $1,149 | $28,310 | $3,060 | $25,250 |
| 2013 | $1,132 | $25,770 | $3,060 | $22,710 |
Source: Public Records
Map
Nearby Homes
- 326 - 328 Maple St
- 624 Saint Marys Ave
- 209 Pike St
- 326 Park St
- 206 E Ln
- 529 Linden Ave
- 512 Sycamore Ave
- 107 N Ohio Ave Unit C
- 105 N Ohio Ave Unit C
- 301 N Miami Ave
- 315 Washington St
- 104 S Pomeroy Ave
- 709 Michigan St
- 729 Michigan St
- 416 Elm St
- 631 N Wagner Ave
- 516 2nd Ave
- 604 2nd Ave
- 413 E Poplar St
- 330 S Walnut Ave
- 212 Grove St Unit 214
- 517 Saint Marys Ave
- 216 Grove St
- 220 Grove St
- 523 Saint Marys Ave
- 201 Grove St
- 414 N Walnut Ave
- 527 Saint Marys Ave
- 527 St Marys
- 224 Grove St Unit 226
- 520 Saint Marys Ave
- 412 1/2 N Walnut Ave
- 412 1/2 N Walnut Ave
- 311 Maple St
- 524 Saint Marys Ave
- 317 Maple St
- 533 Saint Marys Ave
- 227 Maple St
- 302 Grove St
- 408 N Walnut Ave