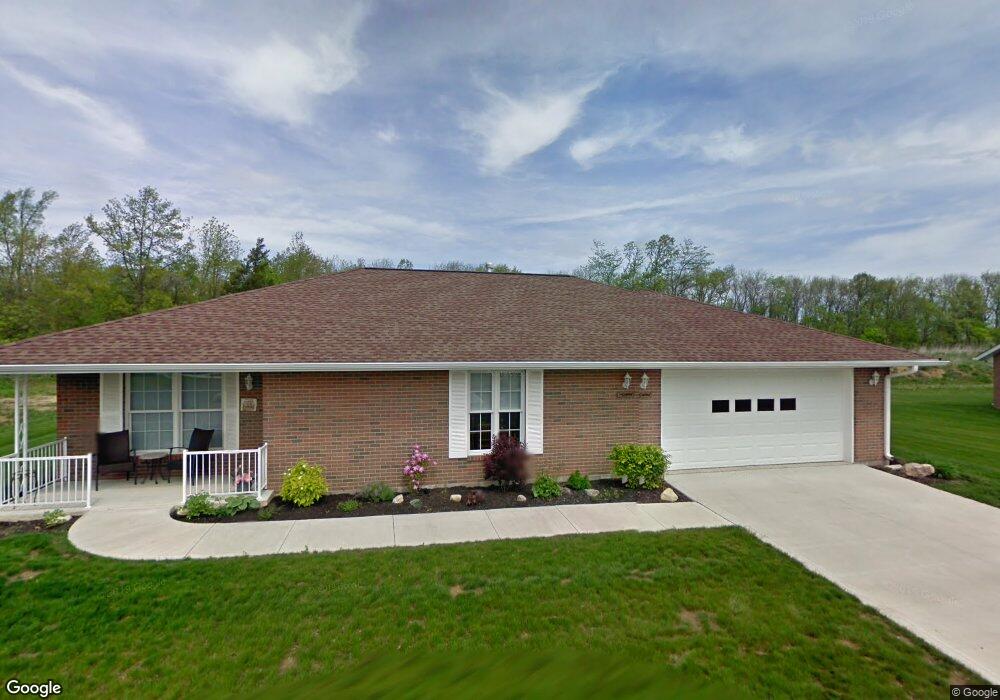
208 Kings Way Unit 30 West Jefferson, OH 43162
Estimated Value: $291,000 - $300,000
2
Beds
2
Baths
1,764
Sq Ft
$167/Sq Ft
Est. Value
About This Home
This home is located at 208 Kings Way Unit 30, West Jefferson, OH 43162 and is currently estimated at $294,548, approximately $166 per square foot. 208 Kings Way Unit 30 is a home located in Madison County with nearby schools including Norwood Elementary School, West Jefferson Middle School, and West Jefferson High School.
Ownership History
Date
Name
Owned For
Owner Type
Purchase Details
Closed on
May 27, 2021
Sold by
Estate Of James R Ervin
Bought by
Milstead April L
Current Estimated Value
Home Financials for this Owner
Home Financials are based on the most recent Mortgage that was taken out on this home.
Original Mortgage
$132,000
Outstanding Balance
$119,510
Interest Rate
2.9%
Mortgage Type
New Conventional
Estimated Equity
$175,038
Purchase Details
Closed on
May 22, 2017
Sold by
Ervin James R
Bought by
James R Ervin
Purchase Details
Closed on
Nov 15, 2006
Sold by
Elboco Enterprises Co
Bought by
Ervin James R and Ervin Nancy J
Home Financials for this Owner
Home Financials are based on the most recent Mortgage that was taken out on this home.
Original Mortgage
$35,000
Interest Rate
6%
Mortgage Type
Construction
Create a Home Valuation Report for This Property
The Home Valuation Report is an in-depth analysis detailing your home's value as well as a comparison with similar homes in the area
Home Values in the Area
Average Home Value in this Area
Purchase History
| Date | Buyer | Sale Price | Title Company |
|---|---|---|---|
| Milstead April L | $232,000 | Elite Land Title | |
| Milstead April L | -- | New Title Company Name | |
| James R Ervin | -- | -- | |
| Ervin James R | $136,900 | None Available |
Source: Public Records
Mortgage History
| Date | Status | Borrower | Loan Amount |
|---|---|---|---|
| Open | Milstead April L | $132,000 | |
| Closed | Milstead April L | $132,000 | |
| Previous Owner | Ervin James R | $35,000 |
Source: Public Records
Tax History Compared to Growth
Tax History
| Year | Tax Paid | Tax Assessment Tax Assessment Total Assessment is a certain percentage of the fair market value that is determined by local assessors to be the total taxable value of land and additions on the property. | Land | Improvement |
|---|---|---|---|---|
| 2024 | $3,574 | $80,840 | $10,630 | $70,210 |
| 2023 | $3,574 | $80,840 | $10,630 | $70,210 |
| 2022 | $2,853 | $60,060 | $8,400 | $51,660 |
| 2021 | $2,448 | $60,060 | $8,400 | $51,660 |
| 2020 | $2,491 | $60,060 | $8,400 | $51,660 |
| 2019 | $2,082 | $51,000 | $8,400 | $42,600 |
| 2018 | $1,936 | $51,000 | $8,400 | $42,600 |
| 2017 | $1,939 | $51,000 | $8,400 | $42,600 |
| 2016 | $1,864 | $48,550 | $8,400 | $40,150 |
| 2015 | $1,944 | $48,550 | $8,400 | $40,150 |
| 2014 | $1,944 | $48,550 | $8,400 | $40,150 |
| 2013 | -- | $44,380 | $8,400 | $35,980 |
Source: Public Records
Map
Nearby Homes
- 700 Shawn Dr Unit 88
- 0 W Jeff Kiousville Rd Unit 225000725
- 622 Brookdale Dr
- 304 Middle Dr
- 1000 W Main St Unit 120
- 63 Jones St
- 125 Dogwood Ct
- 1890 Wilson Rd SE
- 360 State Route 142 NE
- 10763 Southwood Rd
- 8629 Canyon Cove Rd
- 8548 Canyon Cove Rd
- 8873 Canoe Dr
- 8830 Hubbard Dr N
- 749 Hubbard Rd
- 8482 Dover Crest Ct
- 9519 High Free Pike
- 3150 Middle Pike
- 1280 Four Star Dr W
- 1278 Lieutenant Dr
- 202 Kings Way Unit 28
- 205 Kings Way Unit 27
- 436 Aarika Dr Unit 57
- 199 Kings Way Unit 25
- 196 Kings Way Unit 26
- 433 Aarika Dr Unit 60
- 193 Kings Way Unit 23
- 430 Aarika Dr Unit 55
- 190 Kings Way Unit 24
- 226 Kings Way
- 427 Aarika Dr Unit 58
- 187 Kings Way Unit 21
- 424 Aarika Dr Unit 53
- 421 Aarika Dr
- 181 Kings Way Unit 19
- 706 Shawn Dr Unit 86
- 703 Shawn Dr Unit 92
- 418 Aarika Dr Unit 51
- 709 Shawn Dr Unit 90
- 175 Kings Way Unit 17