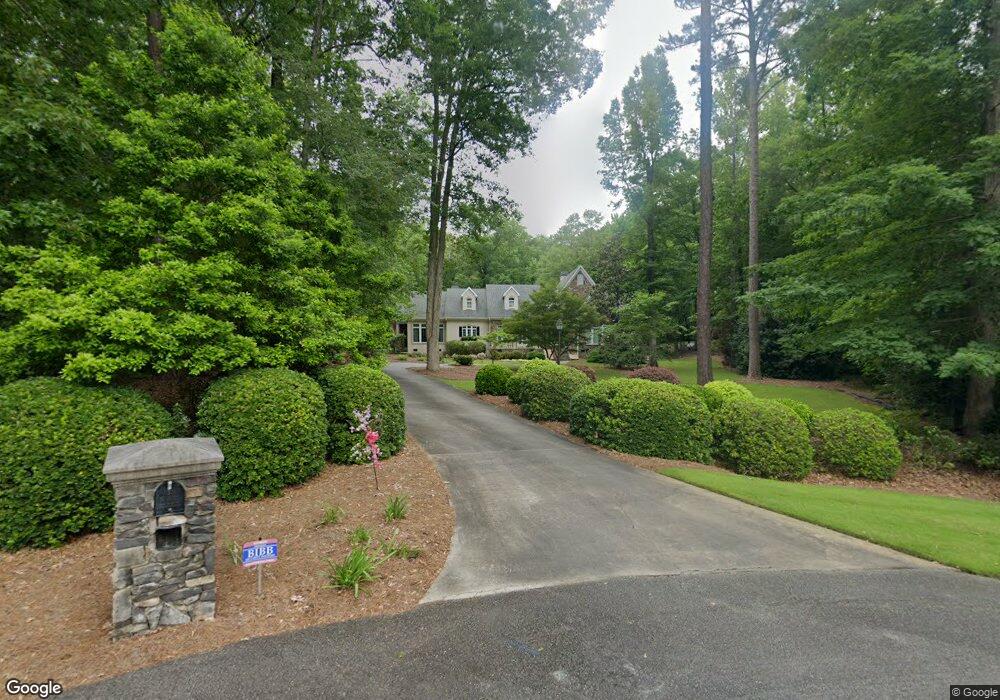
208 Lagrange Ct Macon, GA 31210
Estimated Value: $800,000 - $1,105,915
4
Beds
4
Baths
7,898
Sq Ft
$126/Sq Ft
Est. Value
About This Home
This home is located at 208 Lagrange Ct, Macon, GA 31210 and is currently estimated at $992,479, approximately $125 per square foot. 208 Lagrange Ct is a home located in Bibb County with nearby schools including Carter Elementary School, Howard Middle School, and Howard High School.
Ownership History
Date
Name
Owned For
Owner Type
Purchase Details
Closed on
Jan 31, 2017
Sold by
Hurt Mark A
Bought by
Hurt Teresa R
Current Estimated Value
Home Financials for this Owner
Home Financials are based on the most recent Mortgage that was taken out on this home.
Original Mortgage
$200,000
Outstanding Balance
$2,221
Interest Rate
4.03%
Mortgage Type
Purchase Money Mortgage
Estimated Equity
$990,258
Purchase Details
Closed on
Dec 20, 2016
Sold by
Hurt Teresa R
Bought by
Hurt Mark A
Home Financials for this Owner
Home Financials are based on the most recent Mortgage that was taken out on this home.
Original Mortgage
$200,000
Outstanding Balance
$2,221
Interest Rate
4.03%
Mortgage Type
Purchase Money Mortgage
Estimated Equity
$990,258
Purchase Details
Closed on
Jul 22, 2004
Bought by
Hurt Teresa R
Purchase Details
Closed on
Jun 28, 2000
Create a Home Valuation Report for This Property
The Home Valuation Report is an in-depth analysis detailing your home's value as well as a comparison with similar homes in the area
Purchase History
| Date | Buyer | Sale Price | Title Company |
|---|---|---|---|
| Hurt Teresa R | -- | -- | |
| Hurt Mark A | -- | -- | |
| Hurt Teresa R | $869,000 | -- | |
| -- | $75,000 | -- |
Source: Public Records
Mortgage History
| Date | Status | Borrower | Loan Amount |
|---|---|---|---|
| Open | Hurt Mark A | $200,000 |
Source: Public Records
Tax History
| Year | Tax Paid | Tax Assessment Tax Assessment Total Assessment is a certain percentage of the fair market value that is determined by local assessors to be the total taxable value of land and additions on the property. | Land | Improvement |
|---|---|---|---|---|
| 2025 | $9,018 | $373,984 | $34,256 | $339,728 |
| 2024 | $9,320 | $373,984 | $34,256 | $339,728 |
| 2023 | $10,505 | $361,650 | $25,410 | $336,240 |
| 2022 | $13,344 | $392,423 | $41,040 | $351,383 |
| 2021 | $14,620 | $391,734 | $41,040 | $350,694 |
| 2020 | $14,937 | $391,734 | $41,040 | $350,694 |
| 2019 | $14,208 | $369,965 | $41,040 | $328,925 |
| 2018 | $19,473 | $328,831 | $41,040 | $287,791 |
| 2017 | $12,031 | $328,126 | $41,040 | $287,086 |
| 2016 | $10,818 | $319,673 | $41,040 | $278,633 |
| 2015 | $15,312 | $319,673 | $41,040 | $278,633 |
| 2014 | $15,336 | $319,673 | $41,040 | $278,633 |
Source: Public Records
Map
Nearby Homes
- 6368 Old Forsyth Rd
- 106 Lagrange Place
- 749 Lamar Rd
- 205 Camden Trace
- 1068 Lamar Rd
- 109 Camden Trace
- 157 Camden Trace
- 153 Camden Trace
- 152 Camden Trace
- 103 Howard Oaks Dr
- 1087 Greentree Pkwy
- 210 Jefferson Park Dr
- 150 Lake Wildwood Dr
- 1181 Greentree Pkwy
- 256 Jefferson Cir
- 264 Dolly Madison Ct
- 260 Edgewater Dr
- 302 James Place
- 732 Bass Rd
- 180 Autumn Trace Ct
- 204 Lagrange Ct
- 210 Lagrange Ct
- 210 Lagrange Ct
- LAGRANGE Court
- 124 Lagrange Place
- 213 Lagrange Ct
- 215 Lagrange Ct
- 130 Lagrange Place
- 238 Lagrange Ct
- 219 Lagrange Ct
- 141 Lagrange Place
- 137 Lagrange Place
- 133 Lagrange Place
- 223 Lagrange Ct
- 118 Lagrange Place
- 236 Lagrange Ct
- 232 Lagrange Ct
- 123 Lagrange Place
- 225 Lagrange Ct
- 113 Lagrange Place
Your Personal Tour Guide
Ask me questions while you tour the home.