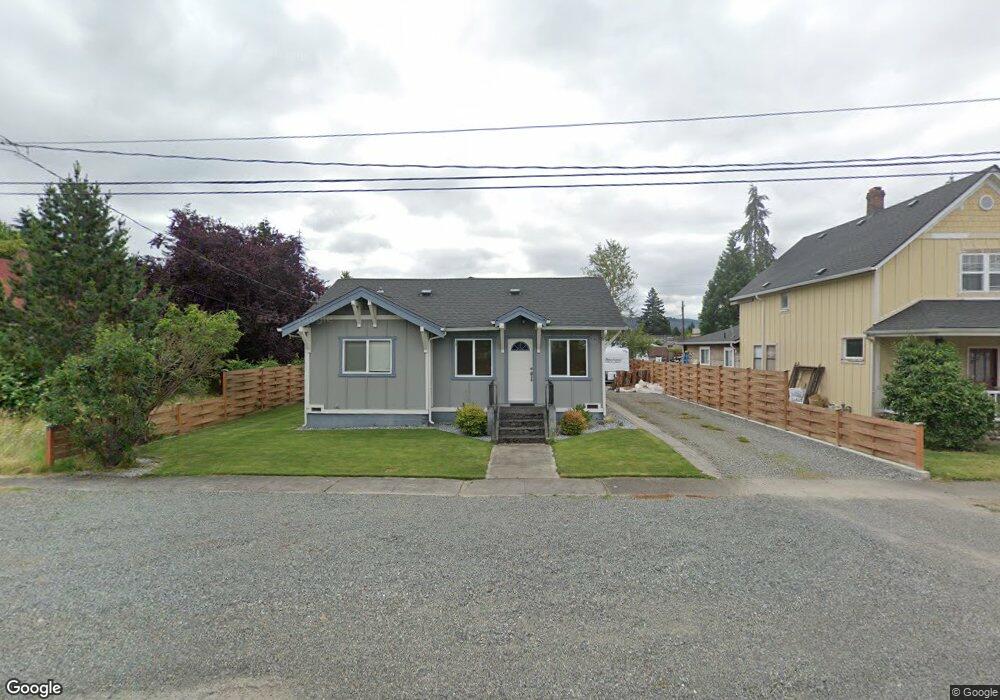
208 Leber St NE Orting, WA 98360
Estimated Value: $388,000 - $464,000
3
Beds
1
Bath
1,224
Sq Ft
$358/Sq Ft
Est. Value
About This Home
This home is located at 208 Leber St NE, Orting, WA 98360 and is currently estimated at $437,998, approximately $357 per square foot. 208 Leber St NE is a home located in Pierce County with nearby schools including Orting Elementary School, Ptarmigan Ridge Elementary School, and Orting Middle School.
Ownership History
Date
Name
Owned For
Owner Type
Purchase Details
Closed on
Jan 5, 2016
Sold by
Moore Teresa
Bought by
Stock Alan
Current Estimated Value
Home Financials for this Owner
Home Financials are based on the most recent Mortgage that was taken out on this home.
Original Mortgage
$139,033
Outstanding Balance
$110,431
Interest Rate
3.92%
Mortgage Type
New Conventional
Estimated Equity
$327,567
Purchase Details
Closed on
Aug 23, 2005
Sold by
Agnew Margarete Anne
Bought by
Agnew Frank C
Purchase Details
Closed on
Sep 21, 2000
Sold by
Catlett Jap
Bought by
Agnew Frank C and Agnew Margarete A
Purchase Details
Closed on
Nov 4, 1995
Sold by
Miller David L and Miller Barbara M
Bought by
Catlett Jap and Catlett Barbara
Home Financials for this Owner
Home Financials are based on the most recent Mortgage that was taken out on this home.
Original Mortgage
$58,000
Interest Rate
7.58%
Create a Home Valuation Report for This Property
The Home Valuation Report is an in-depth analysis detailing your home's value as well as a comparison with similar homes in the area
Home Values in the Area
Average Home Value in this Area
Purchase History
| Date | Buyer | Sale Price | Title Company |
|---|---|---|---|
| Stock Alan | $146,069 | Fidelity National Title | |
| Agnew Frank C | -- | Commonwealth Title Company | |
| Agnew Frank C | $126,000 | -- | |
| Catlett Jap | $93,000 | -- |
Source: Public Records
Mortgage History
| Date | Status | Borrower | Loan Amount |
|---|---|---|---|
| Open | Stock Alan | $139,033 | |
| Previous Owner | Catlett Jap | $58,000 |
Source: Public Records
Tax History Compared to Growth
Tax History
| Year | Tax Paid | Tax Assessment Tax Assessment Total Assessment is a certain percentage of the fair market value that is determined by local assessors to be the total taxable value of land and additions on the property. | Land | Improvement |
|---|---|---|---|---|
| 2025 | $3,452 | $404,800 | $177,600 | $227,200 |
| 2024 | $3,452 | $388,700 | $168,300 | $220,400 |
| 2023 | $3,452 | $359,800 | $160,800 | $199,000 |
| 2022 | $3,267 | $372,800 | $160,800 | $212,000 |
| 2021 | $3,040 | $250,900 | $105,700 | $145,200 |
| 2019 | $2,726 | $226,100 | $89,600 | $136,500 |
| 2018 | $2,396 | $211,400 | $78,100 | $133,300 |
| 2017 | $2,396 | $184,500 | $62,800 | $121,700 |
| 2016 | $2,201 | $142,500 | $49,000 | $93,500 |
| 2014 | $1,824 | $131,300 | $43,700 | $87,600 |
| 2013 | $1,824 | $108,500 | $34,400 | $74,100 |
Source: Public Records
Map
Nearby Homes
- 407 Leber St NE
- 215 Corrin Ave NW Unit B
- 215 Corrin Ave NW Unit A
- 201 River Ave NE
- 304 Varner Ave SE
- 213 Bridge St SW
- 211 Bridge St SW
- 322 Orting Ave NW
- 318 Mill Ave SE
- 506 Deeded Ln SW
- 503 Coe Ln SW
- 317 Icey St SW
- 406 Brown Way SE
- 718 Teetor Cir NW Unit LOT 9
- 724 Teetor Cir NW Unit LOT 12
- 726 Teetor Cir NW Unit Lot 13
- 731 Teetor Cir NW Unit LOT 14
- 710 Teetor Cir NW
- 710 Teetor Cir NW Unit LOT 5
- 730 Teetor Cir NW Unit LOT 31
- 206 Leber St NE
- 300 Leber St NE
- 112 Ammons Ln NE
- 204 Leber St NE
- 114 Ammons Ln NE
- 0 Leber St NE Unit NWM1454398
- 408 Leber St NE
- 0 Leber St NE
- 120 Varner Ave NE
- 203 Bowlin Ave NE
- 106 Ammons Ln NE
- 114 Varner Ave NE
- 304 Leber St NE
- 112 Varner Ave NE
- 202 Varner Ave NE
- 301 Leber St NE
- 110 Varner Ave NE
- 213 Bowlin Ave NE
- 211 Calistoga St W
- 209 Calistoga St E