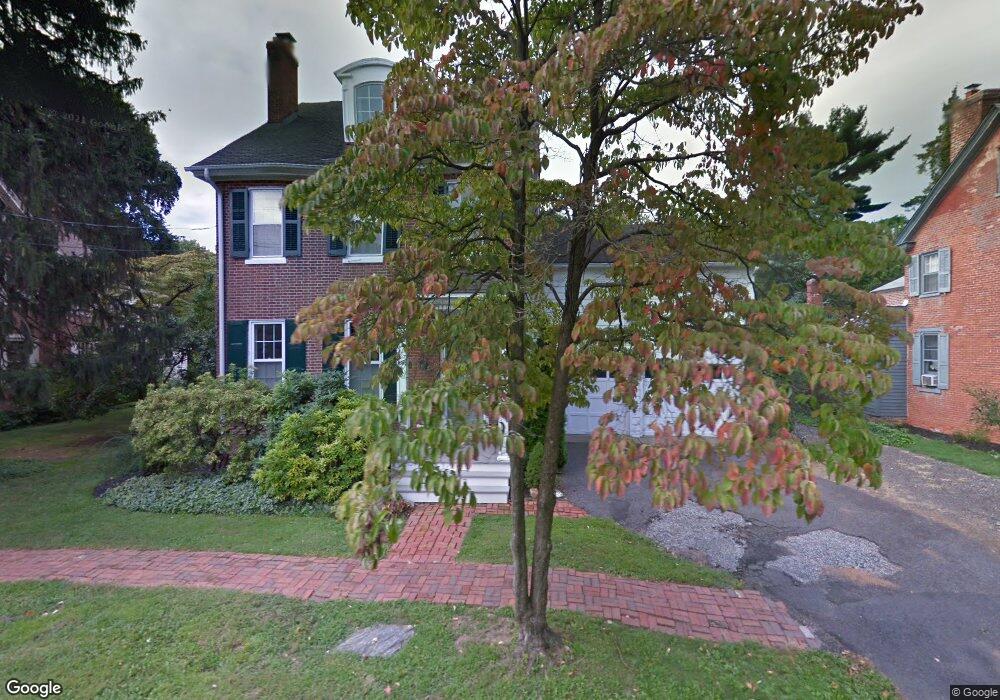
208 Main St Rancocas, NJ 08073
Estimated Value: $478,000 - $585,000
--
Bed
--
Bath
3,239
Sq Ft
$159/Sq Ft
Est. Value
About This Home
This home is located at 208 Main St, Rancocas, NJ 08073 and is currently estimated at $515,380, approximately $159 per square foot. 208 Main St is a home with nearby schools including Holly Hills Elementary School, Westampton Intermediate School, and Rancocas Valley Regional High School.
Ownership History
Date
Name
Owned For
Owner Type
Purchase Details
Closed on
Mar 7, 2024
Sold by
Dunham Gregg B and Dunham Carolynn W
Bought by
Dunham Gregg B and Johnston Alfredo
Current Estimated Value
Purchase Details
Closed on
Jun 17, 2010
Sold by
Williams Emily Anne and Williams Alfred A
Bought by
Dunham Carolynn W and Dunham Gregg B
Purchase Details
Closed on
Jul 2, 1996
Sold by
Williams Emily A
Bought by
Williams Emily A
Create a Home Valuation Report for This Property
The Home Valuation Report is an in-depth analysis detailing your home's value as well as a comparison with similar homes in the area
Home Values in the Area
Average Home Value in this Area
Purchase History
| Date | Buyer | Sale Price | Title Company |
|---|---|---|---|
| Dunham Gregg B | -- | None Listed On Document | |
| Dunham Gregg B | -- | None Listed On Document | |
| Dunham Carolynn W | $300,000 | None Available | |
| Williams Emily A | -- | -- | |
| Dey Jeffrey C | -- | -- |
Source: Public Records
Tax History Compared to Growth
Tax History
| Year | Tax Paid | Tax Assessment Tax Assessment Total Assessment is a certain percentage of the fair market value that is determined by local assessors to be the total taxable value of land and additions on the property. | Land | Improvement |
|---|---|---|---|---|
| 2025 | $8,301 | $305,000 | $80,400 | $224,600 |
| 2024 | $7,987 | $295,500 | $80,400 | $215,100 |
| 2023 | $7,987 | $295,500 | $80,400 | $215,100 |
| 2022 | $7,588 | $295,500 | $80,400 | $215,100 |
| 2021 | $7,308 | $295,500 | $80,400 | $215,100 |
| 2020 | $7,278 | $295,500 | $80,400 | $215,100 |
| 2019 | $7,130 | $295,500 | $80,400 | $215,100 |
| 2018 | $7,039 | $295,500 | $80,400 | $215,100 |
| 2017 | $6,853 | $295,500 | $80,400 | $215,100 |
| 2016 | $6,726 | $295,500 | $80,400 | $215,100 |
| 2015 | $6,596 | $295,500 | $80,400 | $215,100 |
| 2014 | $6,427 | $295,500 | $80,400 | $215,100 |
Source: Public Records
Map
Nearby Homes