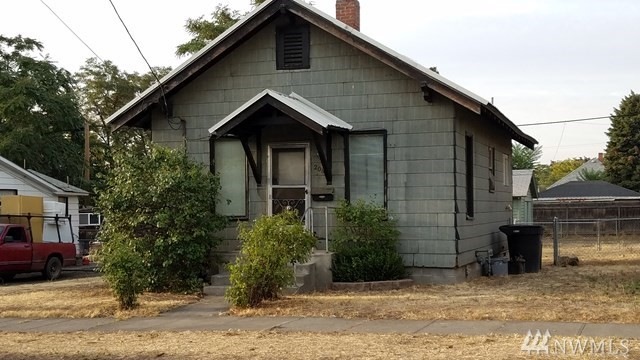
208 Malcolm St Walla Walla, WA 99362
Estimated Value: $181,000 - $275,000
About This Home
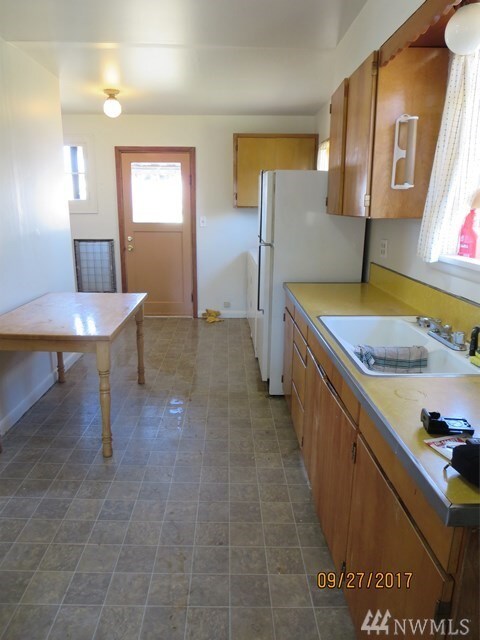
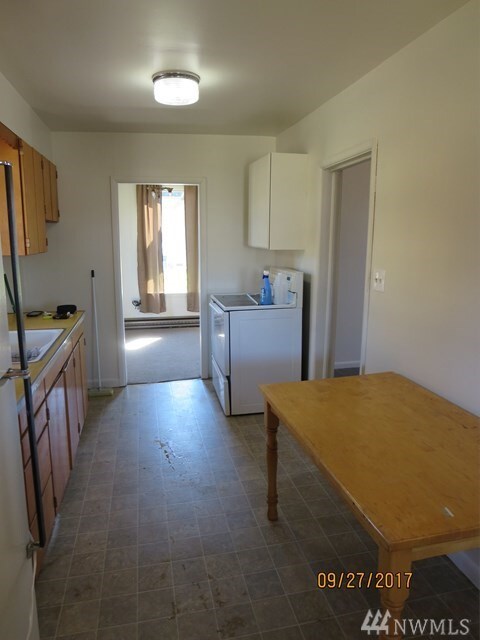
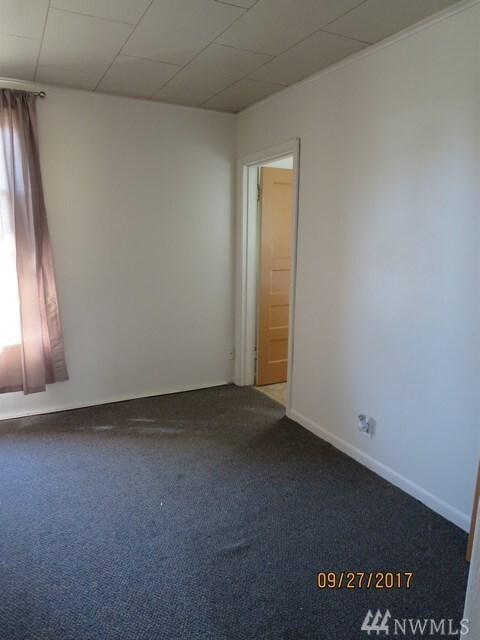
As of January 2018Small, but a great value property. This compact home features a generous lot with garage, shop area, and off alley parking. Close to shopping. Good rental history. Cellar storage.
Home Details
Home Type
- Single Family
Year Built
- Built in 1906
Lot Details
- 4,792
Parking
- Detached Garage
Home Design
- Composition Roof
- Concrete Perimeter Foundation
Additional Features
- City Views
- Oven or Range
- Property is zoned Res 1
Community Details
- Walla Walla Community
Listing and Financial Details
- Assessor Parcel Number 36-07-29-68-2811
Ownership History
Purchase Details
Purchase Details
Home Financials for this Owner
Home Financials are based on the most recent Mortgage that was taken out on this home.Purchase History
| Date | Buyer | Sale Price | Title Company |
|---|---|---|---|
| Millichap Robert J | -- | Land Title | |
| Millichap Joseph R | $76,900 | Land Title | |
| Millchap Jospeh R | $76,900 | Land Title Of Walla Walla Co |
Mortgage History
| Date | Status | Borrower | Loan Amount |
|---|---|---|---|
| Previous Owner | Millchap Jospeh R | $57,675 |
Property History
| Date | Event | Price | List to Sale | Price per Sq Ft |
|---|---|---|---|---|
| 01/29/2018 01/29/18 | Sold | $76,900 | -3.8% | $133 / Sq Ft |
| 11/10/2017 11/10/17 | Pending | -- | -- | -- |
| 09/28/2017 09/28/17 | For Sale | $79,900 | -- | $138 / Sq Ft |
Tax History
| Year | Tax Paid | Tax Assessment Tax Assessment Total Assessment is a certain percentage of the fair market value that is determined by local assessors to be the total taxable value of land and additions on the property. | Land | Improvement |
|---|---|---|---|---|
| 2025 | $1,509 | $192,070 | $50,000 | $142,070 |
| 2024 | $1,350 | $152,410 | $40,000 | $112,410 |
| 2023 | $1,350 | $152,410 | $40,000 | $112,410 |
| 2022 | $1,151 | $143,660 | $31,250 | $112,410 |
| 2021 | $1,120 | $106,190 | $31,250 | $74,940 |
| 2020 | $1,107 | $93,700 | $31,250 | $62,450 |
| 2019 | $745 | $93,700 | $31,250 | $62,450 |
| 2018 | $824 | $68,880 | $30,000 | $38,880 |
| 2017 | $698 | $62,400 | $30,000 | $32,400 |
| 2016 | $675 | $57,000 | $30,000 | $27,000 |
| 2015 | $661 | $52,500 | $30,000 | $22,500 |
| 2014 | -- | $52,500 | $30,000 | $22,500 |
| 2013 | -- | $52,500 | $30,000 | $22,500 |
Map
Source: Northwest Multiple Listing Service (NWMLS)
MLS Number: NWM1699988
APN: 360729682811
Disclaimer: Certain information contained herein is derived from information provided by parties other than Homes.com. All information provided is deemed reliable, but is not guaranteed to be accurate and should be independently verified.
![]() All data is obtained from various sources and may not have been verified by broker or MLS GRID. Supplied Open House Information is subject to change without notice. All information should be independently reviewed and verified for accuracy. Properties may or may not be listed by the office/agent presenting the information. Listing information is provided by the Northwest Multiple Listing Service (NWMLS). Property information is based on available data that may include MLS information, county records, and other sources. Listings marked with the 3 tree icon and provided by NWMLS. All properties are subject to prior sale or withdrawal. IDX information is provided exclusively for consumers’ personal noncommercial use, that it may not be used for any purpose other than to identify prospective properties consumers may be interested in purchasing, that the data is deemed reliable but is not guaranteed by MLS GRID. ©2026 NWMLS.
All data is obtained from various sources and may not have been verified by broker or MLS GRID. Supplied Open House Information is subject to change without notice. All information should be independently reviewed and verified for accuracy. Properties may or may not be listed by the office/agent presenting the information. Listing information is provided by the Northwest Multiple Listing Service (NWMLS). Property information is based on available data that may include MLS information, county records, and other sources. Listings marked with the 3 tree icon and provided by NWMLS. All properties are subject to prior sale or withdrawal. IDX information is provided exclusively for consumers’ personal noncommercial use, that it may not be used for any purpose other than to identify prospective properties consumers may be interested in purchasing, that the data is deemed reliable but is not guaranteed by MLS GRID. ©2026 NWMLS.
Based on information submitted to the MLS GRID
- 201 Malcolm St
- 444 S 4th Ave
- 419 Chase Ave
- 249 Eagan St
- 618 S 2nd Ave
- 1203 S 3rd Ave
- 434 Sprague St
- 15 Eagan St
- 564 S 1st Ave
- 123 E Maple St
- 902 Emma St
- 1390 S 3rd Ave
- 124 Whitman St
- 385 S 1st Ave
- 310 S 10th Ave
- 1014 W Chestnut St
- 622 W Poplar St
- 364 Catherine St Unit F9
- 130 Dice Place
- 1223 Jones Dr
Ask me questions while you tour the home.