Estimated Value: $336,477 - $351,000
3
Beds
2
Baths
1,753
Sq Ft
$195/Sq Ft
Est. Value
About This Home
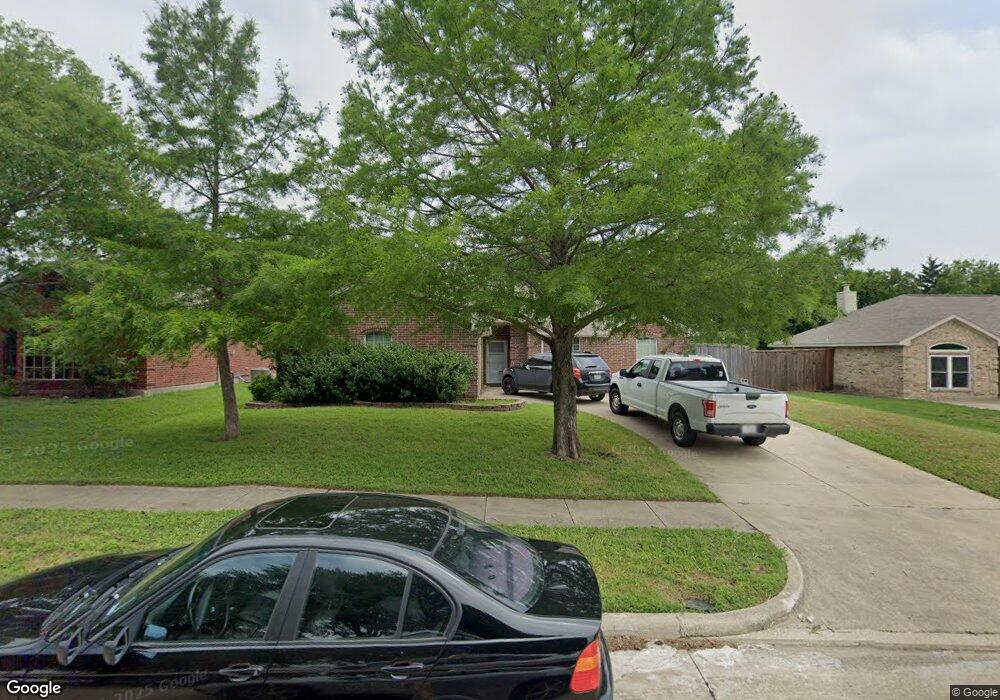
This home is located at 208 N Bending Oak Ln, Wylie, TX 75098 and is currently estimated at $342,119, approximately $195 per square foot. 208 N Bending Oak Ln is a home located in Collin County with nearby schools including P M Akin Elementary School, AB Harrison Intermediate School, and Grady Burnett J High School.
Ownership History
Date
Name
Owned For
Owner Type
Purchase Details
Closed on
May 25, 2010
Sold by
Allen Adam and Allen Heather
Bought by
Stringer Jamee
Current Estimated Value
Home Financials for this Owner
Home Financials are based on the most recent Mortgage that was taken out on this home.
Original Mortgage
$137,153
Outstanding Balance
$91,703
Interest Rate
5%
Mortgage Type
FHA
Estimated Equity
$250,416
Purchase Details
Closed on
Sep 25, 2002
Sold by
Choice Homes Inc
Bought by
Allen Adam
Home Financials for this Owner
Home Financials are based on the most recent Mortgage that was taken out on this home.
Original Mortgage
$139,931
Interest Rate
6.26%
Mortgage Type
FHA
Purchase Details
Closed on
Jul 9, 2002
Sold by
Wylie Oak Meadow Lp
Bought by
Choice Homes Inc
Home Financials for this Owner
Home Financials are based on the most recent Mortgage that was taken out on this home.
Original Mortgage
$12,000,000
Interest Rate
6.78%
Create a Home Valuation Report for This Property
The Home Valuation Report is an in-depth analysis detailing your home's value as well as a comparison with similar homes in the area
Home Values in the Area
Average Home Value in this Area
Purchase History
| Date | Buyer | Sale Price | Title Company |
|---|---|---|---|
| Stringer Jamee | -- | Lawyers Title | |
| Allen Adam | -- | -- | |
| Choice Homes Inc | -- | Commonwealth Land Title Co |
Source: Public Records
Mortgage History
| Date | Status | Borrower | Loan Amount |
|---|---|---|---|
| Open | Stringer Jamee | $137,153 | |
| Previous Owner | Allen Adam | $139,931 | |
| Previous Owner | Choice Homes Inc | $12,000,000 |
Source: Public Records
Tax History Compared to Growth
Tax History
| Year | Tax Paid | Tax Assessment Tax Assessment Total Assessment is a certain percentage of the fair market value that is determined by local assessors to be the total taxable value of land and additions on the property. | Land | Improvement |
|---|---|---|---|---|
| 2025 | $5,263 | $339,889 | $85,000 | $254,889 |
| 2024 | $5,263 | $331,926 | $85,000 | $262,471 |
| 2023 | $5,263 | $301,751 | $85,000 | $263,292 |
| 2022 | $6,018 | $274,319 | $70,000 | $239,577 |
| 2021 | $5,868 | $249,381 | $60,000 | $189,381 |
| 2020 | $5,687 | $229,024 | $60,000 | $169,024 |
| 2019 | $6,096 | $231,985 | $60,000 | $176,406 |
| 2018 | $5,680 | $210,895 | $50,000 | $172,113 |
| 2017 | $5,163 | $206,062 | $45,000 | $161,062 |
| 2016 | $4,843 | $178,604 | $33,000 | $145,604 |
| 2015 | $4,050 | $158,449 | $33,000 | $125,449 |
Source: Public Records
Map
Nearby Homes
- 107 Windy Knoll Ln
- 1056 Fairview Dr
- 1308 London Dr
- 213 N West A Allen Blvd
- 1115 Nighthawk Dr
- 1209 Surrey Cir
- 1312 Wyndham Dr
- 312 Maltese Cir
- 207 Gatwick Ct
- 306 Foxwood Ct
- 407 Sparrow Dr
- 304 Hawthorn Dr
- 310 Hawthorn Dr
- 205 Duck Blind Ave
- 209 Duck Blind Ave
- 409 Cedar Ridge Dr
- 211 Rutherford Ave
- 2801-3 N State Highway 78
- 2801-1 N State Highway 78
- 1201 E Stone Rd
- 206 N Bending Oak Ln
- 210 N Bending Oak Ln
- 204 N Bending Oak Ln
- 209 N Bending Oak Ln
- 211 N Bending Oak Ln
- 207 N Bending Oak Ln
- 202 N Bending Oak Ln
- 203 N Bending Oak Ln
- 200 N Bending Oak Ln
- 208 Windy Knoll Ln
- 210 Windy Knoll Ln
- 210 Windy Knoll Ln
- 206 Windy Knoll Ln
- 204 Windy Knoll Ln
- 201 N Bending Oak Ln
- 112 N Bending Oak Ln
- 202 Windy Knoll Ln
- 113 N Bending Oak Ln
- 225 Wyndham Meadows Way
- 200 Windy Knoll Ln