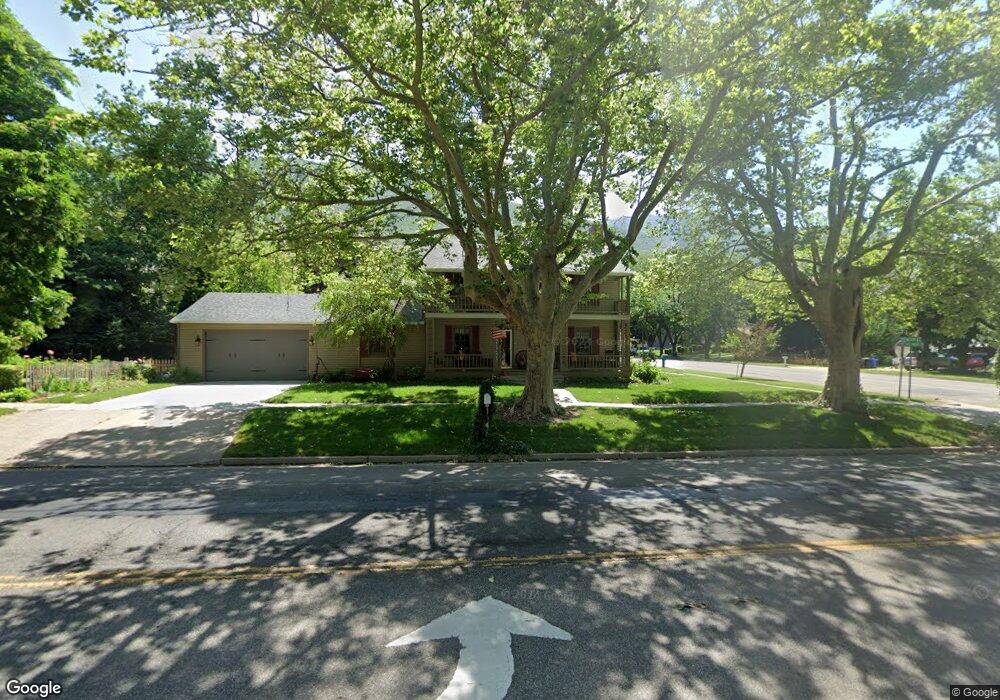
208 N Main St Farmington, UT 84025
Estimated Value: $669,212 - $968,000
4
Beds
2
Baths
3,098
Sq Ft
$252/Sq Ft
Est. Value
About This Home
This home is located at 208 N Main St, Farmington, UT 84025 and is currently estimated at $780,303, approximately $251 per square foot. 208 N Main St is a home located in Davis County with nearby schools including Farmington Elementary School, Farmington High, and Farmington Junior High School.
Ownership History
Date
Name
Owned For
Owner Type
Purchase Details
Closed on
Dec 30, 2015
Sold by
Roosendaal Neil and Roosendaal Judy
Bought by
Roosendaal Judy Neil and Roosendaal Family Trust
Current Estimated Value
Purchase Details
Closed on
Oct 17, 2012
Sold by
Last Frank C and Last Lissa N
Bought by
Roosendaal Neil C and Roosendaal Judy L
Create a Home Valuation Report for This Property
The Home Valuation Report is an in-depth analysis detailing your home's value as well as a comparison with similar homes in the area
Home Values in the Area
Average Home Value in this Area
Purchase History
| Date | Buyer | Sale Price | Title Company |
|---|---|---|---|
| Roosendaal Judy Neil | -- | -- | |
| Roosendaal Neil C | -- | Mountain View Title & |
Source: Public Records
Tax History Compared to Growth
Tax History
| Year | Tax Paid | Tax Assessment Tax Assessment Total Assessment is a certain percentage of the fair market value that is determined by local assessors to be the total taxable value of land and additions on the property. | Land | Improvement |
|---|---|---|---|---|
| 2024 | $2,960 | $295,900 | $182,271 | $113,629 |
| 2023 | $566 | $520,000 | $220,866 | $299,134 |
| 2022 | $797 | $288,200 | $121,895 | $166,305 |
| 2021 | $2,629 | $405,000 | $172,872 | $232,128 |
| 2020 | $2,384 | $358,000 | $145,550 | $212,450 |
| 2019 | $2,286 | $333,000 | $143,915 | $189,085 |
| 2018 | $2,174 | $312,000 | $141,935 | $170,065 |
| 2016 | $1,999 | $147,675 | $61,753 | $85,922 |
| 2015 | $1,909 | $133,870 | $61,753 | $72,117 |
| 2014 | $2,200 | $158,496 | $51,461 | $107,035 |
| 2013 | -- | $154,513 | $48,809 | $105,704 |
Source: Public Records
Map
Nearby Homes
- 170 N Main St
- 21 N 100 W Unit 3
- 139 E 400 N
- 2 Grayson Way N Unit 11
- 1504 W Kiera Court Ct N Unit 150
- 69 W Grove Creek Cir
- 292 N Flag Rock Dr
- 1460 W 550 N Unit 166
- 79 S 300 E
- 334 E Cottrell Ln
- 38 S 300 W
- 52 N 400 W
- 372 W Clark Cir
- 13 Sunset Dr
- 434 W 450 S Unit 815
- 250 S 200 W
- 1941 W 950 N Unit 1
- 1886 W 950 N Unit 3
- 397 W 850 N
- 901 N Compton Rd