208 N Main St Woonsocket, RI 02895
Downtown Woonsocket NeighborhoodEstimated Value: $193,079
Studio
--
Bath
1,485
Sq Ft
$130/Sq Ft
Est. Value
About This Home
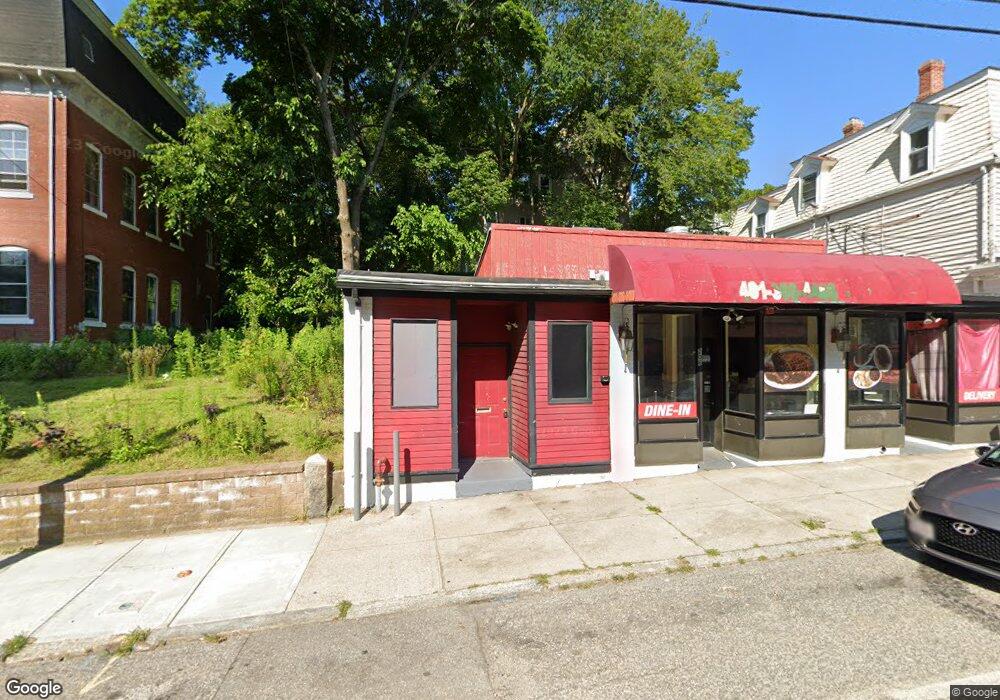
This home is located at 208 N Main St, Woonsocket, RI 02895 and is currently estimated at $193,079, approximately $130 per square foot. 208 N Main St is a home located in Providence County with nearby schools including Woonsocket High School, Rise Prep Mayoral Academy Middle School, and Rise Prep Mayoral Academy.
Ownership History
Date
Name
Owned For
Owner Type
Purchase Details
Closed on
Aug 4, 2023
Sold by
418 Pine Llc
Bought by
Gutierrez Edgardo and King Patricia
Current Estimated Value
Home Financials for this Owner
Home Financials are based on the most recent Mortgage that was taken out on this home.
Original Mortgage
$138,000
Outstanding Balance
$134,495
Interest Rate
6.67%
Mortgage Type
Purchase Money Mortgage
Estimated Equity
$58,584
Create a Home Valuation Report for This Property
The Home Valuation Report is an in-depth analysis detailing your home's value as well as a comparison with similar homes in the area
Home Values in the Area
Average Home Value in this Area
Purchase History
| Date | Buyer | Sale Price | Title Company |
|---|---|---|---|
| Gutierrez Edgardo | $163,000 | None Available | |
| Gutierrez Edgardo | $163,000 | None Available |
Source: Public Records
Mortgage History
| Date | Status | Borrower | Loan Amount |
|---|---|---|---|
| Open | Gutierrez Edgardo | $138,000 | |
| Closed | Gutierrez Edgardo | $138,000 |
Source: Public Records
Tax History
| Year | Tax Paid | Tax Assessment Tax Assessment Total Assessment is a certain percentage of the fair market value that is determined by local assessors to be the total taxable value of land and additions on the property. | Land | Improvement |
|---|---|---|---|---|
| 2025 | $2,458 | $115,400 | $39,200 | $76,200 |
| 2024 | $2,579 | $95,600 | $32,400 | $63,200 |
| 2023 | $2,480 | $95,600 | $32,400 | $63,200 |
| 2022 | $2,480 | $95,600 | $32,400 | $63,200 |
| 2021 | $2,582 | $74,300 | $24,400 | $49,900 |
| 2020 | $2,618 | $74,300 | $24,400 | $49,900 |
| 2018 | $2,689 | $74,300 | $24,400 | $49,900 |
| 2017 | $2,382 | $64,500 | $28,300 | $36,200 |
| 2016 | $2,473 | $64,500 | $28,300 | $36,200 |
| 2015 | $2,625 | $64,500 | $28,300 | $36,200 |
| 2014 | $2,691 | $67,300 | $31,400 | $35,900 |
Source: Public Records
Map
Nearby Homes
- 187 Boyden St
- 164 W School St
- 107 Blackstone St
- 83 Summer St
- 0 N Main St Unit 1401765
- 130 E School St
- 481 N Main St
- 58 Oakley Rd
- 115 Railroad St
- 550 Winter St
- 154 156 Winter St
- 308 Harris Ave
- 180 Allen St Unit 104
- 458 Prospect St
- 56 Winter St
- 99 Allen St Unit 205
- 542 Prospect St
- 35 Greene St
- 42 Elbow St
- 36 Fairmount St
- 204 N Main St
- 210 N Main St Unit 3
- 210 N Main St Unit 2F
- 210 N Main St Unit 2R
- 210 N Main St
- 212 N Main St
- 230 N Main St
- 190 N Main St
- 247 Boyden St
- 233 N Main St
- 222 N Main St
- 259 Boyden St
- 24 Prospect St Unit 2ND
- 201 Boyden St
- 177 W School St
- 195 Boyden St
- 37 Daniels St
- 0 0main St N Unit EC30106625
- 144 N Main St
- 156 Earle St
Your Personal Tour Guide
Ask me questions while you tour the home.