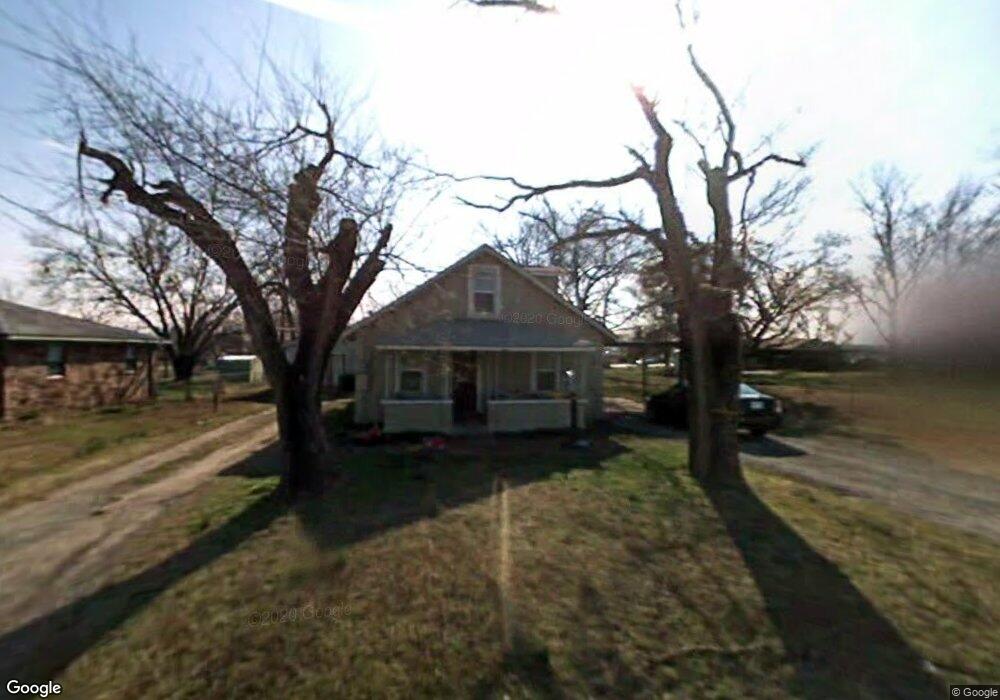
208 N Mccracken St Chouteau, OK 74337
Estimated Value: $103,015 - $142,000
3
Beds
1
Bath
1,188
Sq Ft
$100/Sq Ft
Est. Value
About This Home
This home is located at 208 N Mccracken St, Chouteau, OK 74337 and is currently estimated at $119,254, approximately $100 per square foot. 208 N Mccracken St is a home located in Mayes County with nearby schools including Chouteau-Mazie High School.
Ownership History
Date
Name
Owned For
Owner Type
Purchase Details
Closed on
Jun 25, 2019
Sold by
Snodgrass Robert and Snodgrass Cindy
Bought by
Snodgrass Robert U and Snodgrass Cindy A
Current Estimated Value
Purchase Details
Closed on
Sep 6, 2006
Sold by
Federal Home Loan Mortgage Corporation
Bought by
Snodgrass Robert and Snodgrass Cindy
Home Financials for this Owner
Home Financials are based on the most recent Mortgage that was taken out on this home.
Original Mortgage
$26,354
Interest Rate
6.51%
Mortgage Type
Unknown
Purchase Details
Closed on
Jun 2, 1997
Sold by
Westwind Capital Two
Bought by
Marsh James J
Purchase Details
Closed on
Nov 7, 1996
Sold by
Lockett Allen Lee
Bought by
Sec. Of Housing & Urban
Purchase Details
Closed on
Jan 3, 1996
Sold by
Shoemaker Jerry James
Bought by
Lockett Allen Lee
Purchase Details
Closed on
Jun 24, 1994
Sold by
Carbine Pauline
Bought by
Shoemaker Jerry James
Create a Home Valuation Report for This Property
The Home Valuation Report is an in-depth analysis detailing your home's value as well as a comparison with similar homes in the area
Home Values in the Area
Average Home Value in this Area
Purchase History
| Date | Buyer | Sale Price | Title Company |
|---|---|---|---|
| Snodgrass Robert U | $40,000 | Firstitle & Abstract Svcs Ll | |
| Snodgrass Robert | -- | None Available | |
| Marsh James J | $33,000 | -- | |
| Sec. Of Housing & Urban | -- | -- | |
| Lockett Allen Lee | $36,000 | -- | |
| Shoemaker Jerry James | $3,500 | -- |
Source: Public Records
Mortgage History
| Date | Status | Borrower | Loan Amount |
|---|---|---|---|
| Previous Owner | Snodgrass Robert | $26,354 |
Source: Public Records
Tax History Compared to Growth
Tax History
| Year | Tax Paid | Tax Assessment Tax Assessment Total Assessment is a certain percentage of the fair market value that is determined by local assessors to be the total taxable value of land and additions on the property. | Land | Improvement |
|---|---|---|---|---|
| 2023 | $681 | $7,464 | $2,154 | $5,310 |
| 2022 | $617 | $7,109 | $2,105 | $5,004 |
| 2021 | $617 | $6,771 | $1,929 | $4,842 |
| 2020 | $556 | $6,448 | $1,760 | $4,688 |
| 2019 | $521 | $6,141 | $1,549 | $4,592 |
| 2018 | $513 | $6,141 | $1,549 | $4,592 |
| 2017 | $516 | $6,065 | $1,530 | $4,535 |
| 2016 | $495 | $5,776 | $1,457 | $4,319 |
| 2015 | $487 | $5,502 | $1,388 | $4,114 |
| 2014 | $464 | $5,239 | $1,300 | $3,939 |
Source: Public Records
Map
Nearby Homes
- 116 W Olney St
- 300 N Mccracken St
- 211 Railroad St
- 211 S Railroad St
- 207 N Mccracken St
- 302 N Mccracken St
- 215 N Mccracken St
- 209 N Mccracken St
- 304 N Mccracken St
- 219 N Mccracken St
- 123 N Mccracken St
- 211 Fay Ave
- 308 N Mccracken St
- 115 W Railroad St
- 302 W Cherokee Ave
- 121 N Mccracken St
- 124 N Gray St
- 307 N Mccracken St
- 312 W Cherokee Ave
- 122 N Gray St