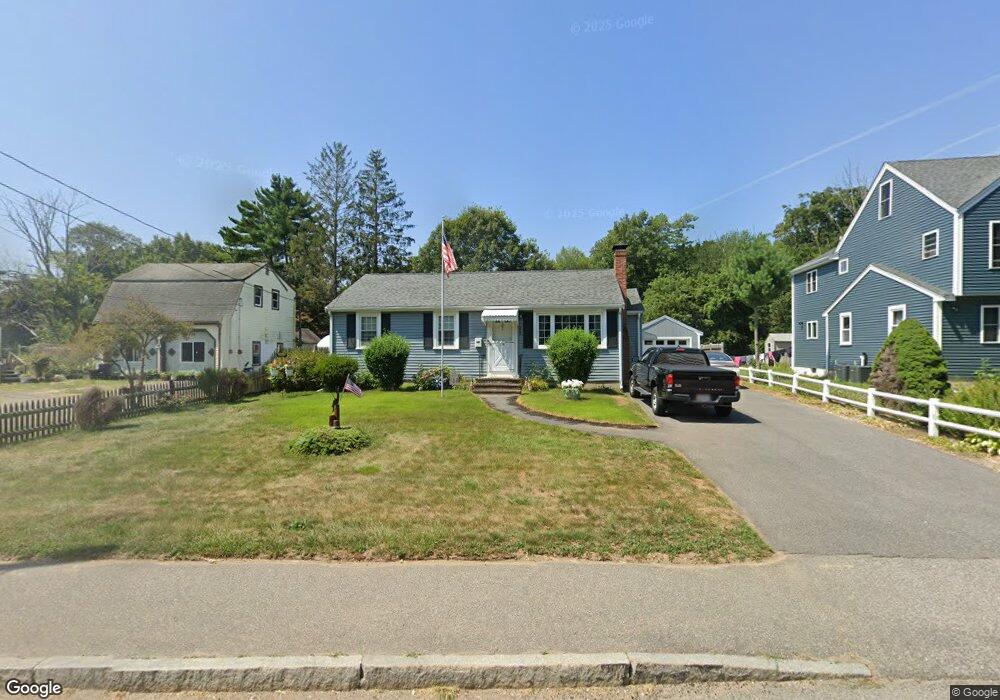
208 N Quincy St Brockton, MA 02302
Montello NeighborhoodEstimated Value: $448,000 - $517,000
4
Beds
1
Bath
906
Sq Ft
$530/Sq Ft
Est. Value
About This Home
This home is located at 208 N Quincy St, Brockton, MA 02302 and is currently estimated at $479,797, approximately $529 per square foot. 208 N Quincy St is a home located in Plymouth County with nearby schools including Brookfield Elementary School, Mary E. Baker Elementary School, and Downey Elementary School.
Ownership History
Date
Name
Owned For
Owner Type
Purchase Details
Closed on
May 17, 2004
Sold by
Stirckland Meredith M and Clark Meredith
Bought by
Sheehan Albert P and Sheehan Rose A
Current Estimated Value
Purchase Details
Closed on
Nov 18, 2002
Sold by
Chatsko Michael P and Chatsko Diane L
Bought by
Clark Meredith
Purchase Details
Closed on
Nov 30, 1995
Sold by
Dilgard Jerry L and Dilgard Mary J
Bought by
Chatsko Michael P and Chatsko Diane L
Create a Home Valuation Report for This Property
The Home Valuation Report is an in-depth analysis detailing your home's value as well as a comparison with similar homes in the area
Home Values in the Area
Average Home Value in this Area
Purchase History
| Date | Buyer | Sale Price | Title Company |
|---|---|---|---|
| Sheehan Albert P | $244,000 | -- | |
| Clark Meredith | $224,900 | -- | |
| Chatsko Michael P | $98,900 | -- |
Source: Public Records
Mortgage History
| Date | Status | Borrower | Loan Amount |
|---|---|---|---|
| Open | Chatsko Michael P | $32,439 | |
| Open | Chatsko Michael P | $248,000 |
Source: Public Records
Tax History Compared to Growth
Tax History
| Year | Tax Paid | Tax Assessment Tax Assessment Total Assessment is a certain percentage of the fair market value that is determined by local assessors to be the total taxable value of land and additions on the property. | Land | Improvement |
|---|---|---|---|---|
| 2025 | $4,938 | $407,800 | $168,700 | $239,100 |
| 2024 | $4,843 | $402,900 | $168,700 | $234,200 |
| 2023 | $4,642 | $357,600 | $135,300 | $222,300 |
| 2022 | $4,333 | $310,200 | $123,700 | $186,500 |
| 2021 | $4,095 | $282,400 | $110,000 | $172,400 |
| 2020 | $4,063 | $268,200 | $105,400 | $162,800 |
| 2019 | $3,904 | $251,200 | $97,700 | $153,500 |
| 2018 | $3,768 | $234,600 | $97,700 | $136,900 |
| 2017 | $3,482 | $216,300 | $97,700 | $118,600 |
| 2016 | $3,323 | $191,400 | $94,400 | $97,000 |
| 2015 | $3,082 | $169,800 | $94,400 | $75,400 |
| 2014 | $3,238 | $178,600 | $94,400 | $84,200 |
Source: Public Records
Map
Nearby Homes
- 216 N Quincy St
- 222 N Quincy St
- 202 N Quincy St
- 196 N Quincy St
- 228 N Quincy St
- 203 N Quincy St
- 199 N Quincy St
- 221 N Quincy St
- 213 N Quincy St
- 188 N Quincy St
- 19 Rosemary St
- 13 Rosemary St
- 21 Annella Rd
- 25 Rosemary St
- 191 N Quincy St
- 191 N Quincy St
- 227 N Quincy St
- 33 Rosemary St
- 182 N Quincy St
- 11 Annella Rd