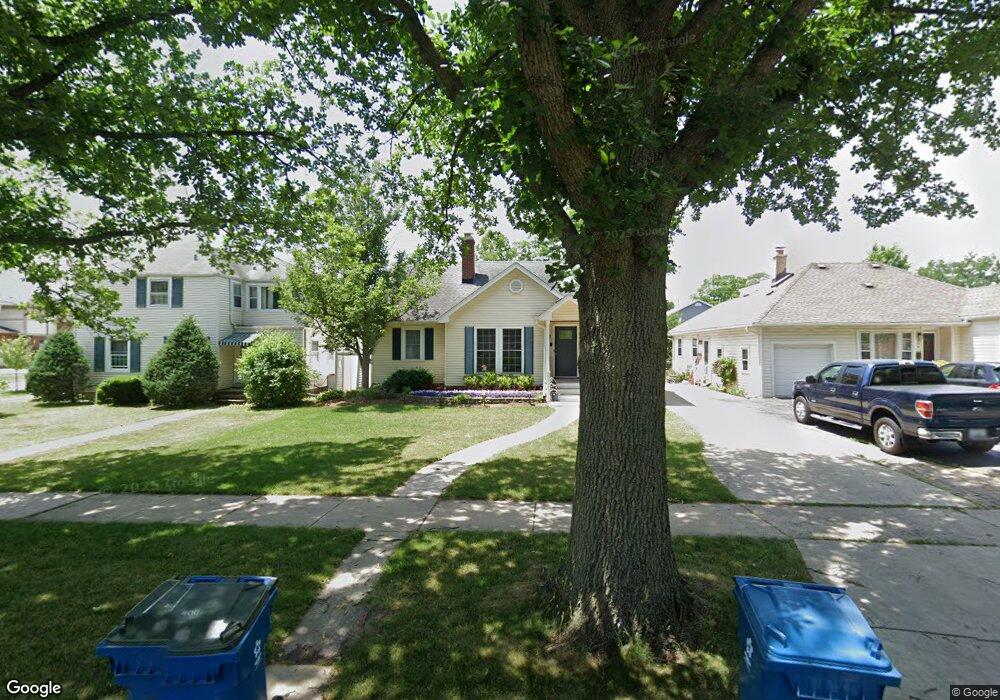
208 N Willow Rd Elmhurst, IL 60126
Estimated Value: $712,108 - $1,134,000
4
Beds
3
Baths
2,426
Sq Ft
$360/Sq Ft
Est. Value
About This Home
This home is located at 208 N Willow Rd, Elmhurst, IL 60126 and is currently estimated at $872,777, approximately $359 per square foot. 208 N Willow Rd is a home located in DuPage County with nearby schools including Field Elementary School, Sandburg Middle School, and York Community High School.
Ownership History
Date
Name
Owned For
Owner Type
Purchase Details
Closed on
Aug 7, 2017
Sold by
Vadalkar Venkatesh and Vadalkar Sejal T
Bought by
Fontana Robert and Fontana Megan M
Current Estimated Value
Home Financials for this Owner
Home Financials are based on the most recent Mortgage that was taken out on this home.
Original Mortgage
$395,000
Outstanding Balance
$328,883
Interest Rate
3.88%
Mortgage Type
New Conventional
Estimated Equity
$543,894
Purchase Details
Closed on
Jun 28, 2011
Sold by
Scott Susan E
Bought by
Vadalkar Venkatesh and Vadalkar Sejal T
Home Financials for this Owner
Home Financials are based on the most recent Mortgage that was taken out on this home.
Original Mortgage
$336,000
Interest Rate
4.56%
Mortgage Type
New Conventional
Purchase Details
Closed on
Sep 29, 2010
Sold by
Scott Matthew T
Bought by
Scott Susan E and Scott Matthew T
Purchase Details
Closed on
Jun 12, 2009
Sold by
Scott Matthew T and Scott Susan E
Bought by
Scott Matthew T and Scott Susan E
Create a Home Valuation Report for This Property
The Home Valuation Report is an in-depth analysis detailing your home's value as well as a comparison with similar homes in the area
Home Values in the Area
Average Home Value in this Area
Purchase History
| Date | Buyer | Sale Price | Title Company |
|---|---|---|---|
| Fontana Robert | $625,000 | Chicago Title Insurance | |
| Vadalkar Venkatesh | $420,000 | Atg | |
| Scott Susan E | -- | None Available | |
| Scott Matthew T | -- | None Available |
Source: Public Records
Mortgage History
| Date | Status | Borrower | Loan Amount |
|---|---|---|---|
| Open | Fontana Robert | $395,000 | |
| Previous Owner | Vadalkar Venkatesh | $336,000 |
Source: Public Records
Tax History
| Year | Tax Paid | Tax Assessment Tax Assessment Total Assessment is a certain percentage of the fair market value that is determined by local assessors to be the total taxable value of land and additions on the property. | Land | Improvement |
|---|---|---|---|---|
| 2024 | $10,998 | $190,499 | $90,675 | $99,824 |
| 2023 | $10,209 | $176,160 | $83,850 | $92,310 |
| 2022 | $9,906 | $169,360 | $80,620 | $88,740 |
| 2021 | $9,660 | $165,140 | $78,610 | $86,530 |
| 2020 | $9,286 | $161,520 | $76,890 | $84,630 |
| 2019 | $9,089 | $153,560 | $73,100 | $80,460 |
| 2018 | $8,972 | $150,830 | $69,200 | $81,630 |
| 2017 | $8,775 | $143,730 | $65,940 | $77,790 |
| 2016 | $8,590 | $135,400 | $62,120 | $73,280 |
| 2015 | $8,503 | $126,140 | $57,870 | $68,270 |
| 2014 | $8,584 | $117,390 | $45,920 | $71,470 |
| 2013 | $8,492 | $119,050 | $46,570 | $72,480 |
Source: Public Records
Map
Nearby Homes
- 272 N Willow Rd
- 286 N Indiana St
- 110 N Willow Rd
- 175 N Berteau Ave
- 195 N Addison Ave Unit PH03
- 234 E Grantley Ave
- 210 N Addison Ave Unit 301N
- 220 N Geneva Ave
- 183 E Grantley Ave
- 153 S Kenmore Ave
- 256 N Addison Ave
- 254 N Addison Ave
- 260 N Addison Ave
- 258 N Addison Ave
- 145 S York St Unit 404
- 135 S York St Unit 314
- 105 S Cottage Hill Ave Unit 304
- 105 S Cottage Hill Ave Unit 204
- 131 W Adelaide St Unit 309
- 176 S Arlington Ave
- 217 E Elmhurst Ave
- 214 N Willow Rd
- 218 N Willow Rd
- 220 N Willow Rd
- 205 N Willow Rd
- 205 N Indiana St
- 216 E Elmhurst Ave
- 207 N Indiana St
- 211 N Indiana St
- 201 N Willow Rd
- 208 E Elmhurst Ave
- 224 N Willow Rd
- 197 N Willow Rd
- 204 E Elmhurst Ave
- 217 N Willow Rd
- 191 N Willow Rd
- 221 N Indiana St
- 188 N Willow Rd
- 228 N Willow Rd
- 223 N Willow Rd
Your Personal Tour Guide
Ask me questions while you tour the home.