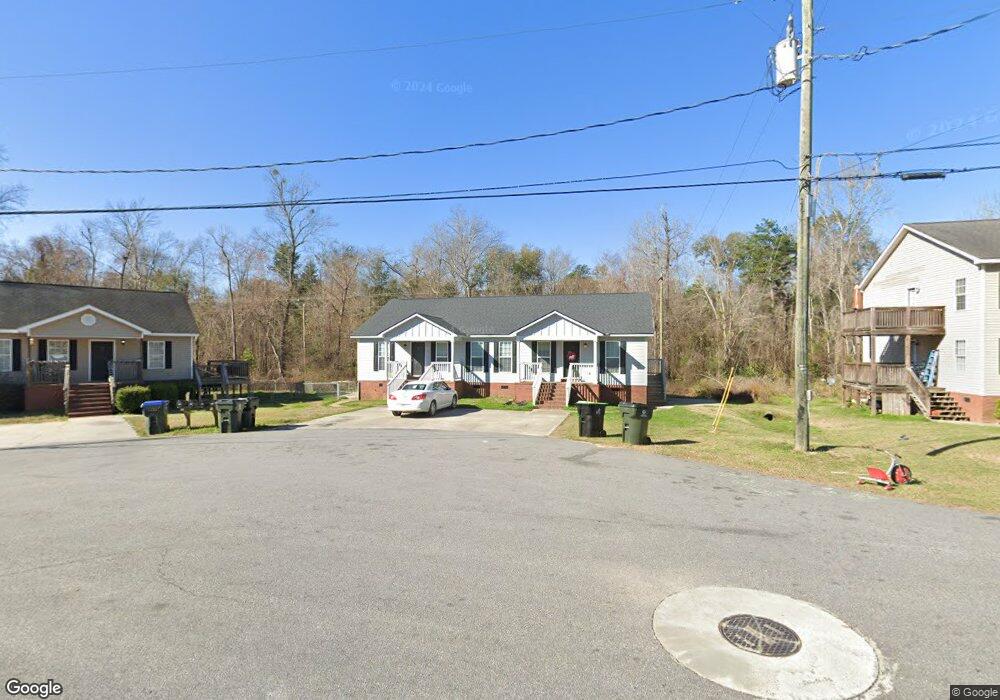
208 Pelham Dr Leesburg, GA 31763
Estimated Value: $201,000 - $229,542
6
Beds
4
Baths
1,960
Sq Ft
$109/Sq Ft
Est. Value
About This Home
This home is located at 208 Pelham Dr, Leesburg, GA 31763 and is currently estimated at $214,386, approximately $109 per square foot. 208 Pelham Dr is a home located in Lee County with nearby schools including Lee County Primary School, Lee County Elementary School, and Lee County Middle School - West Campus.
Ownership History
Date
Name
Owned For
Owner Type
Purchase Details
Closed on
May 7, 2014
Sold by
Schulz Richard E
Bought by
Schulz Properties Llc
Current Estimated Value
Purchase Details
Closed on
Jul 25, 2013
Sold by
Schulz Properties Llc
Bought by
Schulz Richard E
Purchase Details
Closed on
May 3, 2007
Sold by
Schulz Richard E
Bought by
Schulz Properties Llc
Purchase Details
Closed on
Oct 1, 2004
Sold by
Nitram Const Inc
Bought by
Schulz Richard E
Purchase Details
Closed on
May 1, 2002
Sold by
First National Bank
Bought by
Nitram Const Inc
Purchase Details
Closed on
Nov 1, 2001
Sold by
Roth Residential Con
Bought by
First National Bank
Purchase Details
Closed on
Aug 1, 1999
Sold by
Albany Association F
Bought by
Roth Residential Con
Purchase Details
Closed on
Nov 1, 1998
Sold by
Canuga Corp
Bought by
Albany Association F
Create a Home Valuation Report for This Property
The Home Valuation Report is an in-depth analysis detailing your home's value as well as a comparison with similar homes in the area
Home Values in the Area
Average Home Value in this Area
Purchase History
| Date | Buyer | Sale Price | Title Company |
|---|---|---|---|
| Schulz Properties Llc | -- | -- | |
| Schulz Richard E | $100,000 | -- | |
| Schulz Properties Llc | -- | -- | |
| Schulz Richard E | $24,500 | -- | |
| Nitram Const Inc | $22,500 | -- | |
| First National Bank | -- | -- | |
| Roth Residential Con | $16,000 | -- | |
| Albany Association F | -- | -- |
Source: Public Records
Tax History Compared to Growth
Tax History
| Year | Tax Paid | Tax Assessment Tax Assessment Total Assessment is a certain percentage of the fair market value that is determined by local assessors to be the total taxable value of land and additions on the property. | Land | Improvement |
|---|---|---|---|---|
| 2024 | $1,832 | $60,640 | $6,000 | $54,640 |
| 2023 | $1,709 | $60,640 | $6,000 | $54,640 |
| 2022 | $1,709 | $60,640 | $6,000 | $54,640 |
| 2021 | $1,712 | $60,640 | $6,000 | $54,640 |
| 2020 | $1,508 | $45,560 | $600 | $44,960 |
| 2019 | $1,535 | $45,560 | $600 | $44,960 |
| 2018 | $1,536 | $45,560 | $600 | $44,960 |
| 2017 | $1,475 | $46,200 | $600 | $45,600 |
| 2016 | $1,475 | $46,200 | $600 | $45,600 |
| 2015 | $1,483 | $46,200 | $600 | $45,600 |
| 2014 | $1,488 | $46,200 | $600 | $45,600 |
| 2013 | -- | $46,200 | $600 | $45,600 |
Source: Public Records
Map
Nearby Homes
- 116 Saxton Place
- 206 Saxton Place
- 211 Saxton Place
- 110 Saxton Place
- 112 Hidden Cove Ln
- 124 Tuskin Oaks Ct
- 156 Old Hickory Dr
- 111 Chapel Ct
- 707 Creekside Dr
- 147 Lynwood Ln
- 238 Kinchafoonee Creek Rd
- 235 Cedric St
- 161 Old Hickory Dr
- 142 Cuaneta Dr
- 128 Cuaneta Dr
- 125 Tabatha St
- 164 Canuga Dr
- 263 Mayfield Dr
- 153 Canuga Dr
- 128 Laurelwood Ct