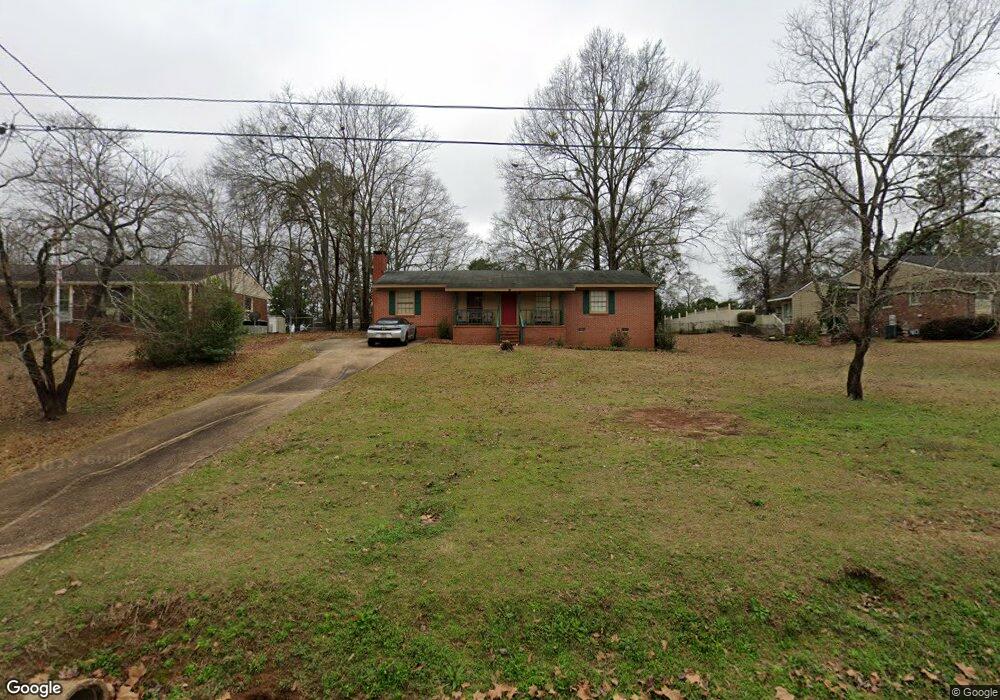
208 Pineview Dr Americus, GA 31709
Estimated Value: $108,652 - $133,000
3
Beds
2
Baths
1,250
Sq Ft
$97/Sq Ft
Est. Value
About This Home
This home is located at 208 Pineview Dr, Americus, GA 31709 and is currently estimated at $121,413, approximately $97 per square foot. 208 Pineview Dr is a home located in Sumter County with nearby schools including Sumter County Primary School, Sumter County Elementary School, and Sumter County Middle School.
Ownership History
Date
Name
Owned For
Owner Type
Purchase Details
Closed on
Sep 27, 2007
Sold by
Fuller Arthur Bernard
Bought by
Battle Dermaris Keeyon
Current Estimated Value
Home Financials for this Owner
Home Financials are based on the most recent Mortgage that was taken out on this home.
Original Mortgage
$81,650
Outstanding Balance
$50,312
Interest Rate
6.41%
Mortgage Type
FHA
Estimated Equity
$71,101
Purchase Details
Closed on
Jul 23, 2002
Sold by
Preskitt Stephen
Bought by
Fuller Arthur Bernard
Purchase Details
Closed on
Apr 2, 1993
Sold by
Associates Relocatin
Bought by
Preskitt Stephen
Purchase Details
Closed on
Mar 31, 1993
Sold by
Wright Wayne L
Bought by
Associates Relocatin
Purchase Details
Closed on
Jul 11, 1986
Sold by
Howell Oscar H
Bought by
Wright Wayne L
Purchase Details
Closed on
Jun 15, 1974
Bought by
Howell Oscar H
Create a Home Valuation Report for This Property
The Home Valuation Report is an in-depth analysis detailing your home's value as well as a comparison with similar homes in the area
Purchase History
| Date | Buyer | Sale Price | Title Company |
|---|---|---|---|
| Battle Dermaris Keeyon | $82,974 | -- | |
| Fuller Arthur Bernard | $65,900 | -- | |
| Preskitt Stephen | $44,000 | -- | |
| Associates Relocatin | $46,400 | -- | |
| Wright Wayne L | $49,900 | -- | |
| Howell Oscar H | $22,900 | -- |
Source: Public Records
Mortgage History
| Date | Status | Borrower | Loan Amount |
|---|---|---|---|
| Open | Battle Dermaris Keeyon | $81,650 |
Source: Public Records
Tax History
| Year | Tax Paid | Tax Assessment Tax Assessment Total Assessment is a certain percentage of the fair market value that is determined by local assessors to be the total taxable value of land and additions on the property. | Land | Improvement |
|---|---|---|---|---|
| 2025 | $1,110 | $26,000 | $3,440 | $22,560 |
| 2024 | $1,110 | $26,000 | $3,440 | $22,560 |
| 2023 | $1,087 | $26,000 | $3,440 | $22,560 |
| 2022 | $725 | $26,000 | $3,440 | $22,560 |
| 2021 | $1,088 | $26,000 | $3,440 | $22,560 |
| 2020 | $1,114 | $26,000 | $3,440 | $22,560 |
| 2019 | $1,181 | $26,000 | $3,440 | $22,560 |
| 2018 | $755 | $26,000 | $3,440 | $22,560 |
| 2017 | $676 | $23,480 | $3,440 | $20,040 |
| 2016 | $975 | $23,480 | $3,440 | $20,040 |
| 2015 | $747 | $26,400 | $3,440 | $22,960 |
| 2014 | $748 | $26,400 | $3,440 | $22,960 |
| 2013 | -- | $26,400 | $3,440 | $22,960 |
Source: Public Records
Map
Nearby Homes
- 113 Clearview Cir
- 1302 Crawford St
- 1720 E Lamar St
- 433 Mayo St
- 620 E Furlow St
- 501 Varsity Dr
- 108 Springfield Ave
- 333 Academy St
- 401 Rigas Rd
- 621 E Church St
- 0 Ashley Rd
- 122 Southland Ridge Dr
- 211 Horne St
- 316 Taylor St
- 518 E Furlow St
- TBD Hillside Dr
- 125 Dellwood Dr
- 111 Cedar Ridge Dr
- 208 Edgewood Dr
- lot 47 Greenwood Dr
- 206 Pineview Dr
- 210 Pineview Dr
- 215 Frieda Ln
- 219 Frieda Ln
- 211 Frieda Ln
- 204 Pineview Dr
- 209 Pineview Dr
- 220 Pineview Dr
- 207 Pineview Dr
- 205 Frieda Ln
- 223 Frieda Ln
- 205 Pineview Dr
- 219 Pineview Place
- 202 Pineview Dr
- 1304 E Jefferson St
- 311 Peggy Ann Dr
- 211 Pineview Place
- 203 Pineview Dr
- 311 Peggy Anne Dr
- 208 Frieda Ln
Your Personal Tour Guide
Ask me questions while you tour the home.