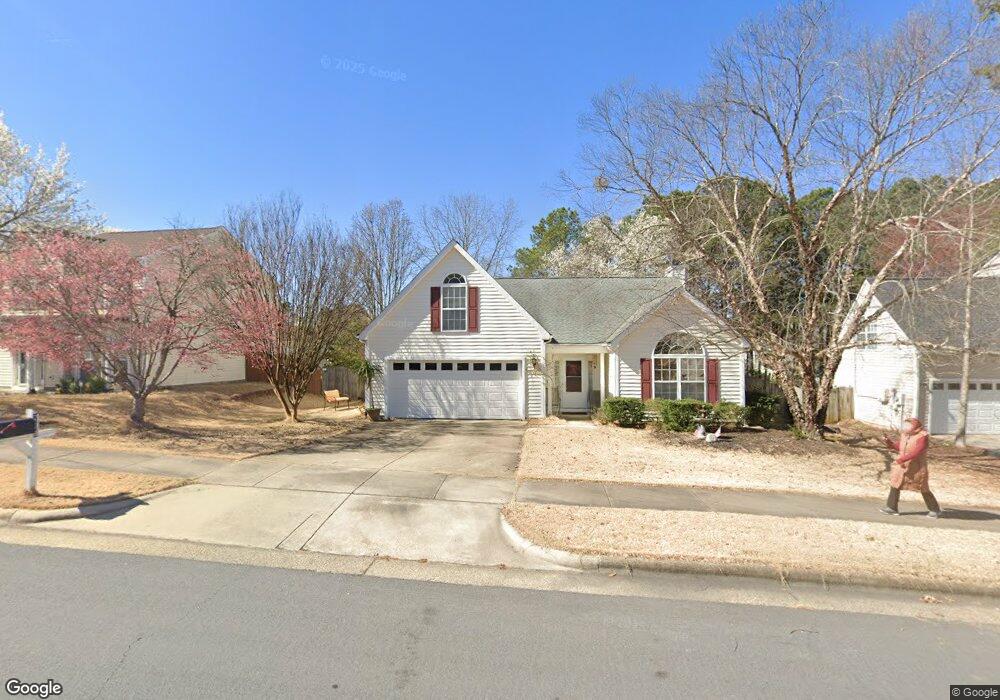
208 Piney Woods Ln Apex, NC 27502
West Apex NeighborhoodEstimated Value: $482,882 - $496,000
3
Beds
2
Baths
1,853
Sq Ft
$263/Sq Ft
Est. Value
About This Home
This home is located at 208 Piney Woods Ln, Apex, NC 27502 and is currently estimated at $487,471, approximately $263 per square foot. 208 Piney Woods Ln is a home located in Wake County with nearby schools including Olive Chapel Elementary School, Lufkin Road Middle School, and Apex Friendship High School.
Ownership History
Date
Name
Owned For
Owner Type
Purchase Details
Closed on
Sep 29, 2008
Sold by
Lauro Anita D
Bought by
Vitale Vincent A and Vitale Antionette G
Current Estimated Value
Purchase Details
Closed on
Nov 15, 2005
Sold by
Kawiecki Gordon M and Kawiecki Cynthia A
Bought by
Lauro Anita D
Home Financials for this Owner
Home Financials are based on the most recent Mortgage that was taken out on this home.
Original Mortgage
$110,000
Interest Rate
5.87%
Mortgage Type
Fannie Mae Freddie Mac
Purchase Details
Closed on
Dec 18, 2002
Sold by
Gress Larry M and Gress Paula S
Bought by
Kawiecki Gordon M and Kawiecki Cynthia A
Home Financials for this Owner
Home Financials are based on the most recent Mortgage that was taken out on this home.
Original Mortgage
$125,200
Interest Rate
5.47%
Purchase Details
Closed on
Jan 21, 1998
Sold by
Pulte Home Corp
Bought by
Gress Larry M and Gress Paula S
Create a Home Valuation Report for This Property
The Home Valuation Report is an in-depth analysis detailing your home's value as well as a comparison with similar homes in the area
Home Values in the Area
Average Home Value in this Area
Purchase History
| Date | Buyer | Sale Price | Title Company |
|---|---|---|---|
| Vitale Vincent A | $212,000 | None Available | |
| Lauro Anita D | $184,000 | None Available | |
| Kawiecki Gordon M | $156,500 | -- | |
| Gress Larry M | $142,000 | -- |
Source: Public Records
Mortgage History
| Date | Status | Borrower | Loan Amount |
|---|---|---|---|
| Previous Owner | Lauro Anita D | $110,000 | |
| Previous Owner | Lauro Anita D | $61,950 | |
| Previous Owner | Kawiecki Gordon M | $125,200 |
Source: Public Records
Tax History Compared to Growth
Tax History
| Year | Tax Paid | Tax Assessment Tax Assessment Total Assessment is a certain percentage of the fair market value that is determined by local assessors to be the total taxable value of land and additions on the property. | Land | Improvement |
|---|---|---|---|---|
| 2025 | -- | $451,016 | $180,000 | $271,016 |
| 2024 | $3,869 | $451,016 | $180,000 | $271,016 |
| 2023 | $3,440 | $311,758 | $80,000 | $231,758 |
| 2022 | $3,230 | $311,758 | $80,000 | $231,758 |
| 2021 | $3,106 | $311,758 | $80,000 | $231,758 |
| 2020 | $3,075 | $311,758 | $80,000 | $231,758 |
| 2019 | $2,750 | $240,375 | $75,000 | $165,375 |
| 2018 | $2,591 | $240,375 | $75,000 | $165,375 |
| 2017 | $2,412 | $240,375 | $75,000 | $165,375 |
| 2016 | $0 | $240,375 | $75,000 | $165,375 |
| 2015 | -- | $217,179 | $50,000 | $167,179 |
| 2014 | -- | $217,179 | $50,000 | $167,179 |
Source: Public Records
Map
Nearby Homes
- 2007 Winecott Dr
- 1512 Piazzo Ct
- 109 Kinship Ln
- 1467 Hasse Ave
- 3916 Chapel Oak Dr
- 2799 Cassius Dr
- 1484 Hasse Ave
- 105 Grassy Ridge Ct
- 1329 Gordonia Way
- 2880 Angelica Rose Way
- 2538 Olive Chapel Rd
- 3119 Cregler Dr
- 2801 Farmhouse Dr
- 312 Brierridge Dr
- 2819 Farmhouse Dr
- 2798 Farmhouse Dr
- 2806 Farmhouse Dr
- 505 Brickstone Dr
- 2524 Olive Chapel Rd
- 2528 Olive Chapel Rd
- 210 Piney Woods Ln
- 206 Piney Woods Ln
- 203 Caristonia Way
- 205 Caristonia Way
- 201 Caristonia Way
- 204 Piney Woods Ln
- 209 Piney Woods Ln
- 105 Alice Ct
- 207 Piney Woods Ln
- 211 Piney Woods Ln
- 213 Piney Woods Ln
- 202 Piney Woods Ln
- 205 Piney Woods Ln
- 106 Alice Ct
- 200 Caristonia Way
- 103 Alice Ct
- 215 Piney Woods Ln
- 207 Grassy Point Rd
- 205 Grassy Point Rd
- 202 Caristonia Way