Estimated Value: $112,055 - $156,000
3
Beds
2
Baths
1,302
Sq Ft
$106/Sq Ft
Est. Value
About This Home
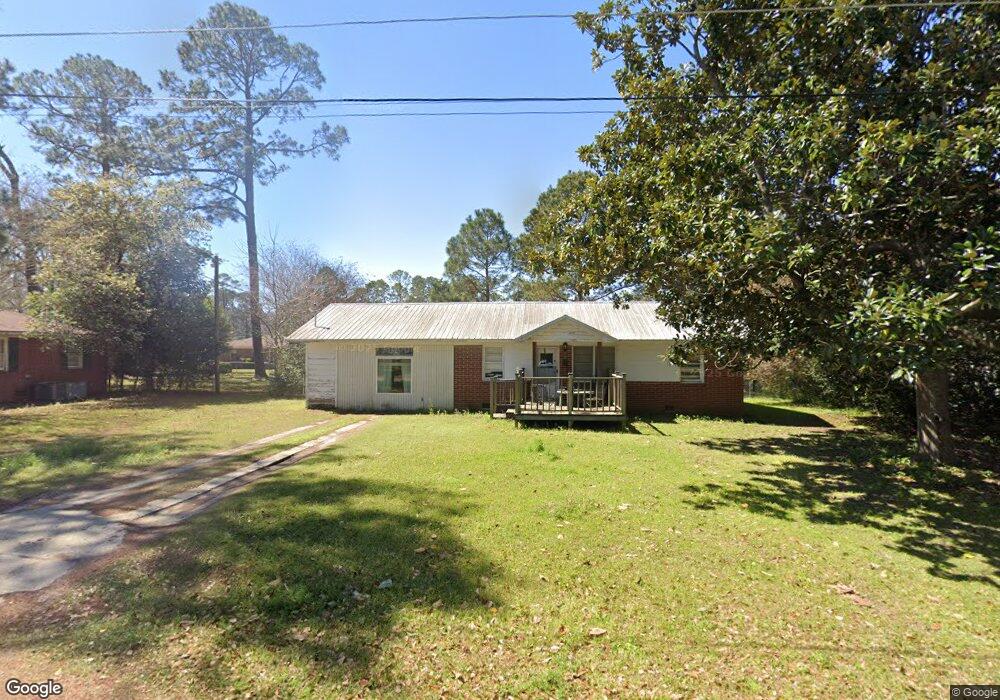
This home is located at 208 Redbud Dr, Adel, GA 31620 and is currently estimated at $137,514, approximately $105 per square foot. 208 Redbud Dr is a home located in Cook County with nearby schools including Cook Primary School, Cook Elementary School, and Cook County Middle School.
Ownership History
Date
Name
Owned For
Owner Type
Purchase Details
Closed on
Aug 30, 2019
Sold by
Arnold Terry Randell
Bought by
Hopper Charles Maxwell
Current Estimated Value
Home Financials for this Owner
Home Financials are based on the most recent Mortgage that was taken out on this home.
Original Mortgage
$54,000
Interest Rate
3.7%
Mortgage Type
New Conventional
Purchase Details
Closed on
Dec 10, 2013
Sold by
The Citizens Bank
Bought by
Arnold Terry Randell
Home Financials for this Owner
Home Financials are based on the most recent Mortgage that was taken out on this home.
Original Mortgage
$38,351
Interest Rate
4.38%
Mortgage Type
New Conventional
Purchase Details
Closed on
Mar 5, 2013
Sold by
Hood James E
Bought by
The Citizens Bank
Purchase Details
Closed on
Feb 26, 2009
Sold by
Hood Thelma
Bought by
Hood James E
Purchase Details
Closed on
May 31, 2007
Sold by
Durpee Susie
Bought by
Hood Jim and Hood Thelma
Create a Home Valuation Report for This Property
The Home Valuation Report is an in-depth analysis detailing your home's value as well as a comparison with similar homes in the area
Home Values in the Area
Average Home Value in this Area
Purchase History
| Date | Buyer | Sale Price | Title Company |
|---|---|---|---|
| Hopper Charles Maxwell | $60,000 | -- | |
| Arnold Terry Randell | $44,900 | -- | |
| The Citizens Bank | -- | -- | |
| Hood James E | -- | -- | |
| Hood Jim | $3,000 | -- |
Source: Public Records
Mortgage History
| Date | Status | Borrower | Loan Amount |
|---|---|---|---|
| Closed | Hopper Charles Maxwell | $54,000 | |
| Previous Owner | Arnold Terry Randell | $38,351 |
Source: Public Records
Tax History
| Year | Tax Paid | Tax Assessment Tax Assessment Total Assessment is a certain percentage of the fair market value that is determined by local assessors to be the total taxable value of land and additions on the property. | Land | Improvement |
|---|---|---|---|---|
| 2025 | $833 | $32,348 | $6,801 | $25,547 |
| 2024 | $943 | $28,618 | $5,376 | $23,242 |
| 2023 | $812 | $24,643 | $4,800 | $19,843 |
| 2022 | $812 | $24,643 | $4,800 | $19,843 |
| 2021 | $733 | $20,784 | $4,800 | $15,984 |
| 2020 | $733 | $20,784 | $4,800 | $15,984 |
| 2019 | $694 | $19,674 | $4,800 | $14,874 |
| 2018 | $695 | $19,674 | $4,800 | $14,874 |
| 2017 | $695 | $19,674 | $4,800 | $14,874 |
| 2016 | $696 | $19,674 | $4,800 | $14,874 |
| 2015 | $697 | $19,674 | $4,800 | $14,874 |
| 2014 | $637 | $20,784 | $4,800 | $15,984 |
| 2013 | -- | $23,670 | $4,800 | $18,870 |
Source: Public Records
Map
Nearby Homes
- 203 Magnolia Dr
- 220 High St
- 708 Town And Country Dr
- 609 E 4th St
- 313 S Forrest Ave
- 315 Newton Dr
- 403 E 2nd St
- 700 S Gordon Ave
- 411 S Hutchinson Ave
- 806 S Forrest Ave
- 625 Coxstill Rd
- 221 Goldenrod Cir
- 1002 Bear Creek Rd
- 526 E Mitchell St
- 412 Honeysuckle Way
- 509 E Mitchell St
- 814 N Cleveland Ave
- 309 Wayne St
- 507 S Poplar St
- 1402 Bear Creek Rd
Your Personal Tour Guide
Ask me questions while you tour the home.