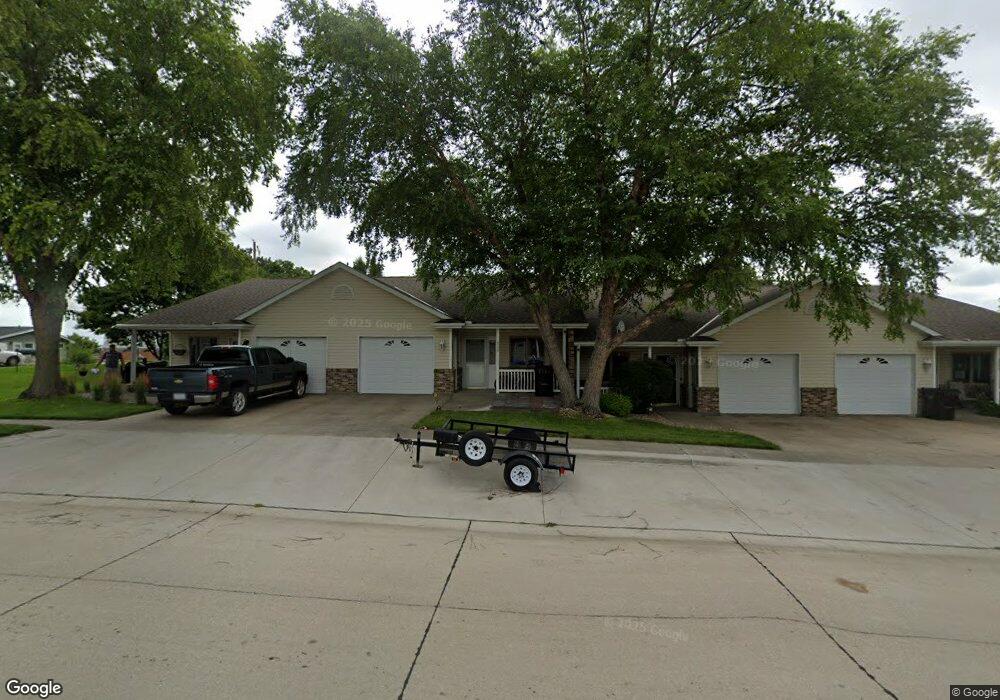
208 S 3rd St Humphrey, NE 68642
Estimated Value: $160,000 - $215,000
2
Beds
1
Bath
1,241
Sq Ft
$147/Sq Ft
Est. Value
About This Home
This home is located at 208 S 3rd St, Humphrey, NE 68642 and is currently estimated at $182,973, approximately $147 per square foot. 208 S 3rd St is a home with nearby schools including Humphrey Elementary School, Lindsay Attendance Center, and Humphrey Junior/Senior High School.
Ownership History
Date
Name
Owned For
Owner Type
Purchase Details
Closed on
Oct 13, 2021
Sold by
Kallweit Lori A and Kallweit Carroll
Bought by
Baumgart Timothy S and Baumgart Jennifer M
Current Estimated Value
Purchase Details
Closed on
Jan 22, 2020
Sold by
Kallweit Lori A and Boning Shirley M
Bought by
Kallweit Lori A
Purchase Details
Closed on
Oct 19, 2016
Sold by
Wemhoff Thomas R
Bought by
Boning Shirley M
Purchase Details
Closed on
Jun 30, 2006
Sold by
Eisenmenger Elaine
Bought by
Wemhoff Thomas R
Create a Home Valuation Report for This Property
The Home Valuation Report is an in-depth analysis detailing your home's value as well as a comparison with similar homes in the area
Home Values in the Area
Average Home Value in this Area
Purchase History
| Date | Buyer | Sale Price | Title Company |
|---|---|---|---|
| Baumgart Timothy S | $123,888 | None Listed On Document | |
| Kallweit Lori A | -- | None Available | |
| Boning Shirley M | $109,000 | None Available | |
| Wemhoff Thomas R | -- | -- |
Source: Public Records
Tax History Compared to Growth
Tax History
| Year | Tax Paid | Tax Assessment Tax Assessment Total Assessment is a certain percentage of the fair market value that is determined by local assessors to be the total taxable value of land and additions on the property. | Land | Improvement |
|---|---|---|---|---|
| 2024 | $1,423 | $152,930 | $6,490 | $146,440 |
| 2023 | $1,439 | $122,420 | $6,490 | $115,930 |
| 2022 | $1,451 | $116,650 | $6,490 | $110,160 |
| 2021 | $1,543 | $118,255 | $6,490 | $111,765 |
| 2020 | $1,545 | $118,255 | $6,490 | $111,765 |
| 2019 | $548 | $120,090 | $4,870 | $115,220 |
| 2018 | $1,520 | $120,090 | $4,870 | $115,220 |
| 2017 | $1,345 | $107,560 | $4,870 | $102,690 |
| 2016 | $0 | $107,560 | $4,870 | $102,690 |
| 2015 | $1,303 | $107,560 | $4,870 | $102,690 |
| 2014 | -- | $82,525 | $4,870 | $77,655 |
| 2012 | -- | $79,980 | $3,245 | $76,735 |
Source: Public Records
Map
Nearby Homes