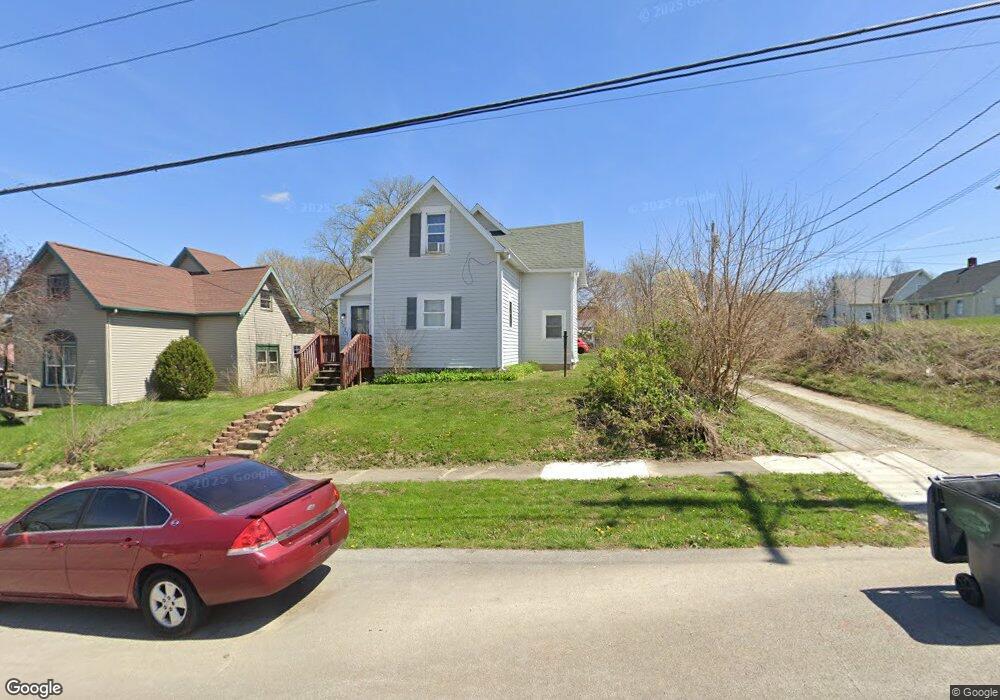
208 S John St Frankton, IN 46044
Estimated Value: $131,000 - $183,000
5
Beds
1
Bath
2,040
Sq Ft
$79/Sq Ft
Est. Value
About This Home
This home is located at 208 S John St, Frankton, IN 46044 and is currently estimated at $161,344, approximately $79 per square foot. 208 S John St is a home located in Madison County with nearby schools including Frankton Elementary School and Frankton Junior/Senior High School.
Ownership History
Date
Name
Owned For
Owner Type
Purchase Details
Closed on
Mar 29, 2023
Sold by
Hamby Gary L
Bought by
Hamby Family Irrevocable Grantor Trust
Current Estimated Value
Purchase Details
Closed on
Nov 25, 2009
Sold by
Wells Fargo Bank N A
Bought by
Hamby Ruth
Purchase Details
Closed on
Aug 7, 2009
Sold by
Detrick Melissa M and Detrick Timothy C
Bought by
Wells Fargo Bank Na
Purchase Details
Closed on
Mar 21, 2005
Sold by
Hudson Patrick E
Bought by
Detrick Melissa M and Detrick Timothy C
Home Financials for this Owner
Home Financials are based on the most recent Mortgage that was taken out on this home.
Original Mortgage
$72,250
Interest Rate
5.71%
Mortgage Type
New Conventional
Create a Home Valuation Report for This Property
The Home Valuation Report is an in-depth analysis detailing your home's value as well as a comparison with similar homes in the area
Home Values in the Area
Average Home Value in this Area
Purchase History
| Date | Buyer | Sale Price | Title Company |
|---|---|---|---|
| Hamby Family Irrevocable Grantor Trust | -- | -- | |
| Hamby Ruth | -- | -- | |
| Wells Fargo Bank Na | $37,400 | -- | |
| Detrick Melissa M | -- | -- |
Source: Public Records
Mortgage History
| Date | Status | Borrower | Loan Amount |
|---|---|---|---|
| Previous Owner | Detrick Melissa M | $72,250 |
Source: Public Records
Tax History
| Year | Tax Paid | Tax Assessment Tax Assessment Total Assessment is a certain percentage of the fair market value that is determined by local assessors to be the total taxable value of land and additions on the property. | Land | Improvement |
|---|---|---|---|---|
| 2025 | $1,110 | $63,400 | $7,100 | $56,300 |
| 2024 | $1,110 | $55,500 | $7,100 | $48,400 |
| 2023 | $1,012 | $50,600 | $6,700 | $43,900 |
| 2022 | $1,008 | $50,400 | $6,500 | $43,900 |
| 2021 | $936 | $46,800 | $6,500 | $40,300 |
| 2020 | $890 | $44,500 | $6,200 | $38,300 |
| 2019 | $868 | $43,400 | $6,200 | $37,200 |
| 2018 | $843 | $40,900 | $6,200 | $34,700 |
| 2017 | $810 | $40,500 | $6,200 | $34,300 |
| 2016 | $733 | $35,400 | $6,200 | $29,200 |
| 2014 | $702 | $35,100 | $6,200 | $28,900 |
| 2013 | $702 | $35,100 | $6,200 | $28,900 |
Source: Public Records
Map
Nearby Homes
Your Personal Tour Guide
Ask me questions while you tour the home.