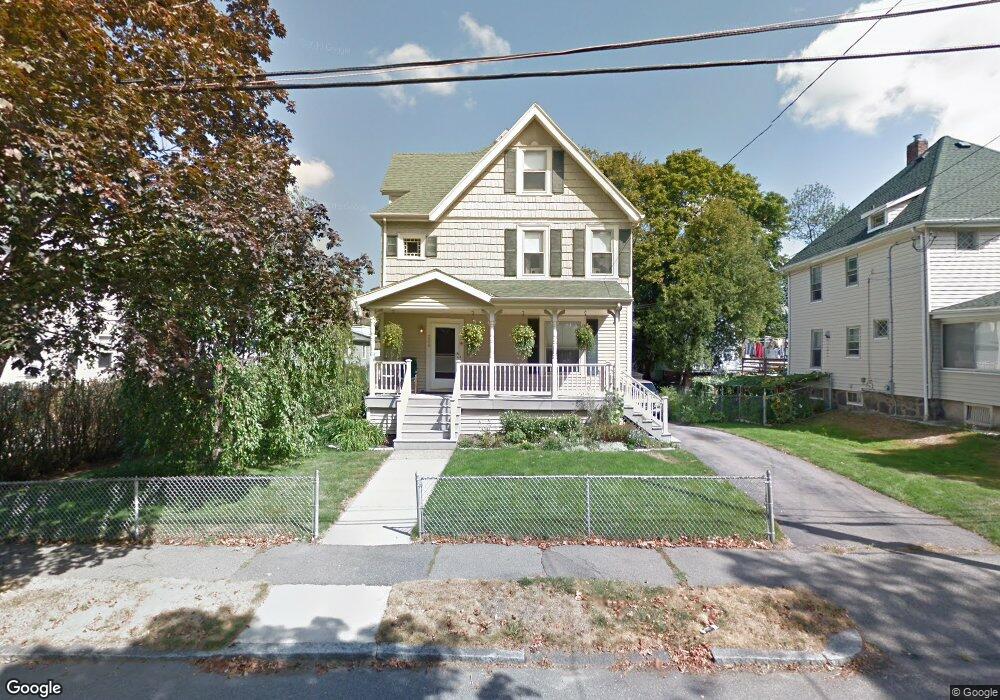
208 Safford St Quincy, MA 02170
Wollaston NeighborhoodEstimated Value: $747,000 - $823,000
4
Beds
2
Baths
1,625
Sq Ft
$484/Sq Ft
Est. Value
About This Home
This home is located at 208 Safford St, Quincy, MA 02170 and is currently estimated at $785,829, approximately $483 per square foot. 208 Safford St is a home located in Norfolk County with nearby schools including Montclair Elementary School, Atlantic Middle School, and North Quincy High School.
Ownership History
Date
Name
Owned For
Owner Type
Purchase Details
Closed on
Feb 5, 2013
Sold by
Seegraber Rita E
Bought by
Rita E Seegraber Nt
Current Estimated Value
Purchase Details
Closed on
May 1, 1987
Sold by
Weston Exr Edward L
Bought by
Kelly Michael J
Home Financials for this Owner
Home Financials are based on the most recent Mortgage that was taken out on this home.
Original Mortgage
$139,500
Interest Rate
8.99%
Mortgage Type
Purchase Money Mortgage
Create a Home Valuation Report for This Property
The Home Valuation Report is an in-depth analysis detailing your home's value as well as a comparison with similar homes in the area
Home Values in the Area
Average Home Value in this Area
Purchase History
| Date | Buyer | Sale Price | Title Company |
|---|---|---|---|
| Rita E Seegraber Nt | -- | -- | |
| Kelly Michael J | $155,000 | -- |
Source: Public Records
Mortgage History
| Date | Status | Borrower | Loan Amount |
|---|---|---|---|
| Previous Owner | Kelly Michael J | $134,500 | |
| Previous Owner | Kelly Michael J | $139,500 |
Source: Public Records
Tax History Compared to Growth
Tax History
| Year | Tax Paid | Tax Assessment Tax Assessment Total Assessment is a certain percentage of the fair market value that is determined by local assessors to be the total taxable value of land and additions on the property. | Land | Improvement |
|---|---|---|---|---|
| 2025 | $8,624 | $748,000 | $380,900 | $367,100 |
| 2024 | $8,291 | $735,700 | $380,900 | $354,800 |
| 2023 | $7,705 | $692,300 | $362,800 | $329,500 |
| 2022 | $7,480 | $624,400 | $315,500 | $308,900 |
| 2021 | $7,257 | $597,800 | $300,400 | $297,400 |
| 2020 | $7,109 | $571,900 | $300,400 | $271,500 |
| 2019 | $6,764 | $539,000 | $280,800 | $258,200 |
| 2018 | $6,650 | $498,500 | $260,000 | $238,500 |
| 2017 | $6,191 | $436,900 | $247,700 | $189,200 |
| 2016 | $5,626 | $391,800 | $215,300 | $176,500 |
| 2015 | $5,215 | $357,200 | $195,800 | $161,400 |
| 2014 | $5,014 | $337,400 | $186,400 | $151,000 |
Source: Public Records
Map
Nearby Homes
- 250 Fayette St
- 143 Arlington St
- 129-131 Pine St
- 11 Earle St
- 169 Pine St
- 100 Grandview Ave Unit 11A
- 111 Warren Ave Unit 1F
- 17 Holmes St Unit 2
- 17 Holmes St Unit 4
- 121 Hillside Ave
- 115 W Squantum St Unit 907
- 115 W Squantum St Unit 810
- 465 Newport Ave
- 101 Beach St
- 171 Milton St
- 22 Newton Ave
- 163 Clay St Unit C
- 65 Barham Ave
- 11 Rockwell Ave
- 18 Eaton St
- 202 Safford St Unit 2
- 202 Safford St
- 202 Safford St Unit 3
- 214 Safford St
- 201 Safford St
- 75 N Central Ave Unit 79
- 207 Safford St
- 64 N Central Ave
- 220 Safford St Unit 1
- 218 Safford St
- 217 Farrington St Unit 3/F
- 223 Farrington St
- 223 Farrington St Unit 1
- 219 Farrington St
- 227 Farrington St
- 227 Farrington St Unit 2
- 229 Farrington St
- 71 N Central Ave
- 215 Farrington St
- 215 Farrington St Unit 1