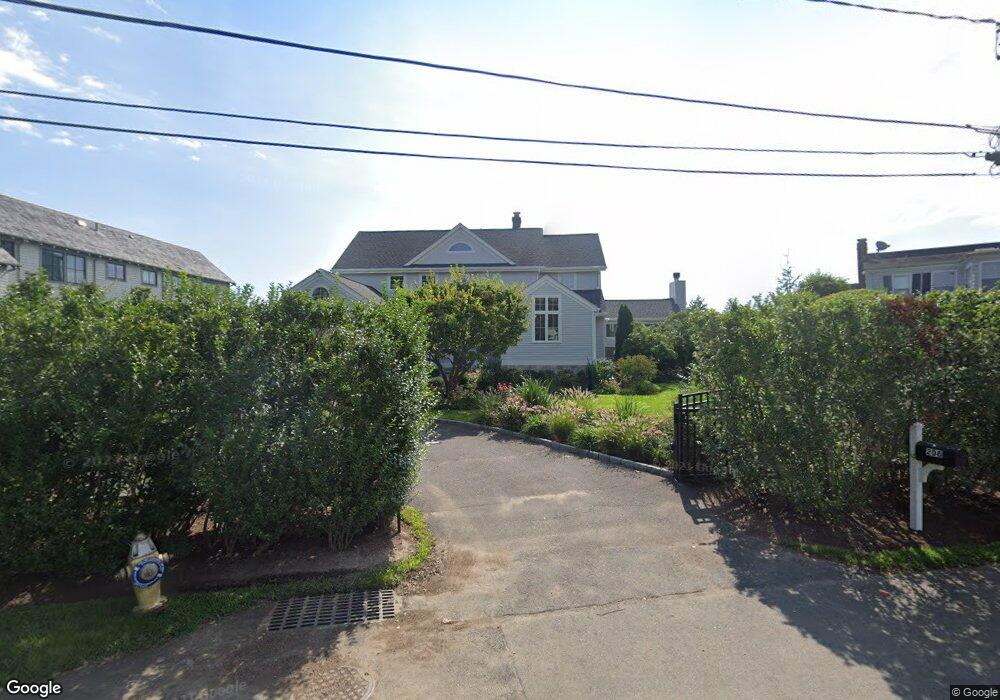
208 Shore Rd Old Greenwich, CT 06870
Old Greenwich NeighborhoodEstimated Value: $5,311,000 - $7,031,330
4
Beds
6
Baths
3,806
Sq Ft
$1,537/Sq Ft
Est. Value
About This Home
This home is located at 208 Shore Rd, Old Greenwich, CT 06870 and is currently estimated at $5,849,583, approximately $1,536 per square foot. 208 Shore Rd is a home located in Fairfield County with nearby schools including Old Greenwich School, Eastern Middle School, and Greenwich High School.
Ownership History
Date
Name
Owned For
Owner Type
Purchase Details
Closed on
Nov 2, 2015
Sold by
Brivic Elisabeth
Bought by
Weindling Alexander and Brivic Elisabeth
Current Estimated Value
Purchase Details
Closed on
Sep 14, 2004
Sold by
Paredegot Stephen and Philibindegot Kenneth
Bought by
Weindling Alexander G and Brivic Elizabeth B
Home Financials for this Owner
Home Financials are based on the most recent Mortgage that was taken out on this home.
Original Mortgage
$3,225,000
Interest Rate
6.08%
Purchase Details
Closed on
Oct 15, 1997
Sold by
Winchester J David
Bought by
Schmidt-Degot C
Create a Home Valuation Report for This Property
The Home Valuation Report is an in-depth analysis detailing your home's value as well as a comparison with similar homes in the area
Home Values in the Area
Average Home Value in this Area
Purchase History
| Date | Buyer | Sale Price | Title Company |
|---|---|---|---|
| Weindling Alexander | -- | -- | |
| Weindling Alexander G | $4,125,000 | -- | |
| Schmidt-Degot C | $1,600,000 | -- |
Source: Public Records
Mortgage History
| Date | Status | Borrower | Loan Amount |
|---|---|---|---|
| Previous Owner | Schmidt-Degot C | $3,200,000 | |
| Previous Owner | Schmidt-Degot C | $3,225,000 | |
| Previous Owner | Schmidt-Degot C | $1,320,000 |
Source: Public Records
Tax History Compared to Growth
Tax History
| Year | Tax Paid | Tax Assessment Tax Assessment Total Assessment is a certain percentage of the fair market value that is determined by local assessors to be the total taxable value of land and additions on the property. | Land | Improvement |
|---|---|---|---|---|
| 2025 | $47,865 | $3,872,890 | $3,220,000 | $652,890 |
| 2024 | $46,227 | $3,872,890 | $3,220,000 | $652,890 |
| 2023 | $45,065 | $3,872,890 | $3,220,000 | $652,890 |
| 2022 | $44,654 | $3,872,890 | $3,220,000 | $652,890 |
| 2021 | $43,415 | $3,605,910 | $2,752,190 | $853,720 |
| 2020 | $43,343 | $3,605,910 | $2,752,190 | $853,720 |
| 2019 | $43,776 | $3,605,910 | $2,752,190 | $853,720 |
| 2018 | $42,802 | $3,605,910 | $2,752,190 | $853,720 |
| 2017 | $43,339 | $3,605,910 | $2,752,190 | $853,720 |
| 2016 | $42,654 | $3,605,910 | $2,752,190 | $853,720 |
| 2015 | $37,893 | $3,177,580 | $2,685,970 | $491,610 |
| 2014 | $36,939 | $3,177,580 | $2,685,970 | $491,610 |
Source: Public Records
Map
Nearby Homes