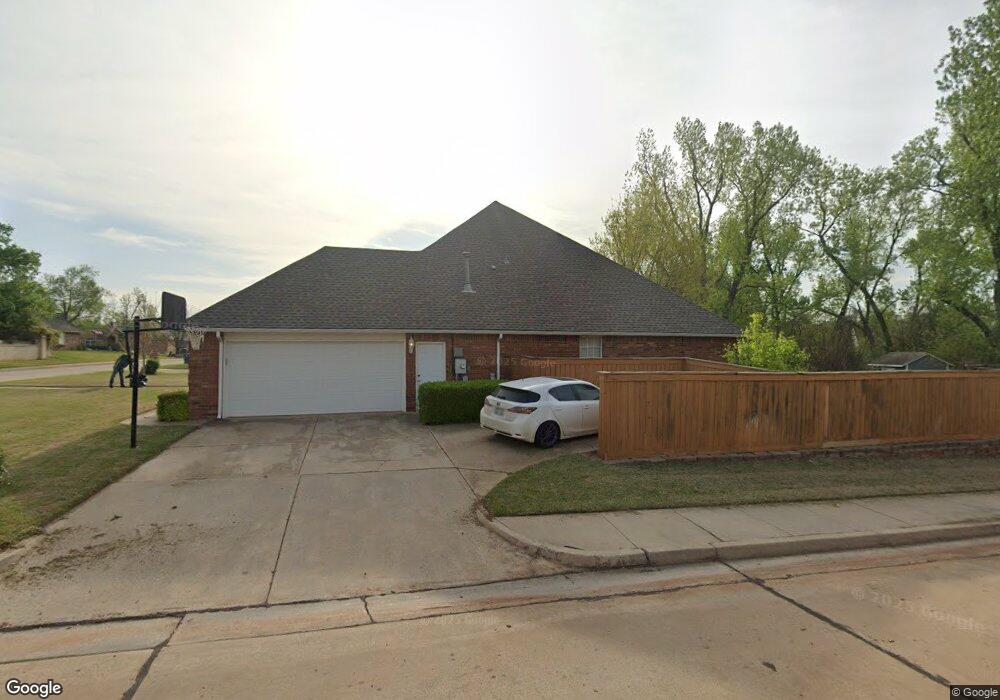
208 Timberdale Terrace Edmond, OK 73034
Brookhaven North NeighborhoodEstimated Value: $340,095 - $383,000
4
Beds
3
Baths
2,475
Sq Ft
$147/Sq Ft
Est. Value
About This Home
This home is located at 208 Timberdale Terrace, Edmond, OK 73034 and is currently estimated at $363,774, approximately $146 per square foot. 208 Timberdale Terrace is a home located in Oklahoma County with nearby schools including Northern Hills Elementary School, Sequoyah Middle School, and North High School.
Ownership History
Date
Name
Owned For
Owner Type
Purchase Details
Closed on
Mar 7, 2022
Sold by
Ross Thurman Clifford
Bought by
Thurman Dawn Deann
Current Estimated Value
Home Financials for this Owner
Home Financials are based on the most recent Mortgage that was taken out on this home.
Original Mortgage
$245,176
Outstanding Balance
$228,472
Interest Rate
3.69%
Mortgage Type
FHA
Estimated Equity
$135,302
Purchase Details
Closed on
Feb 24, 2022
Sold by
Ross Thurman Clifford
Bought by
Thurman Dawn Deann
Home Financials for this Owner
Home Financials are based on the most recent Mortgage that was taken out on this home.
Original Mortgage
$245,176
Outstanding Balance
$228,472
Interest Rate
3.69%
Mortgage Type
FHA
Estimated Equity
$135,302
Purchase Details
Closed on
Jun 15, 2001
Sold by
Stanley David P and Stanley Julie Anne Stark
Bought by
Thurman Clifford R and Thurman Dawn D
Create a Home Valuation Report for This Property
The Home Valuation Report is an in-depth analysis detailing your home's value as well as a comparison with similar homes in the area
Home Values in the Area
Average Home Value in this Area
Purchase History
| Date | Buyer | Sale Price | Title Company |
|---|---|---|---|
| Thurman Dawn Deann | -- | Chicago Title | |
| Thurman Dawn Deann | -- | Chicago Title | |
| Thurman Clifford R | $170,500 | Stewart Abstract & Title | |
| Thurman Clifford R | -- | Stewart Abstract & Title |
Source: Public Records
Mortgage History
| Date | Status | Borrower | Loan Amount |
|---|---|---|---|
| Open | Thurman Dawn Deann | $245,176 | |
| Closed | Thurman Dawn Deann | $245,176 |
Source: Public Records
Tax History Compared to Growth
Tax History
| Year | Tax Paid | Tax Assessment Tax Assessment Total Assessment is a certain percentage of the fair market value that is determined by local assessors to be the total taxable value of land and additions on the property. | Land | Improvement |
|---|---|---|---|---|
| 2024 | $3,011 | $30,785 | $3,097 | $27,688 |
| 2023 | $3,011 | $29,888 | $3,096 | $26,792 |
| 2022 | $2,932 | $29,018 | $3,524 | $25,494 |
| 2021 | $2,830 | $28,173 | $3,834 | $24,339 |
| 2020 | $2,778 | $27,353 | $3,926 | $23,427 |
| 2019 | $2,707 | $26,556 | $3,881 | $22,675 |
| 2018 | $2,641 | $25,783 | $0 | $0 |
| 2017 | $2,549 | $25,031 | $3,726 | $21,305 |
| 2016 | $2,466 | $24,302 | $2,994 | $21,308 |
| 2015 | $2,389 | $23,595 | $3,147 | $20,448 |
| 2014 | $2,313 | $22,907 | $3,225 | $19,682 |
Source: Public Records
Map
Nearby Homes
- 404 Timber Ridge Rd
- 503 Hunters Ct
- 249 Cobblestone Cir
- 1713 Timber Ridge Rd
- 611 Sunny Brook Dr
- 709 Timber Ridge Dr
- 2026 Appalachian Trail
- 2301 Brookside Ave
- 2500 Hidden Hollow Dr
- 422 Oregon Trail
- 326 Bozeman Trail
- 2401 Brookdale Ave
- 405 Bright Angel Trail
- 2802 Coldbrook Ln
- 2901 Stonebrook Rd
- 1804 Saint Christopher Dr
- 117 Stonebrook Way
- 1016 Olde Bridge Rd
- 6017 Royal Abbey Ct
- 2501 Valley Brook Dr
- 212 Timberdale Terrace
- 204 Timberdale Terrace
- 300 Timberdale Terrace
- 200 Timberdale Terrace
- 304 Timberdale Terrace
- 2101 Timberdale Dr
- 1951 Cobblestone Ct
- 1901 Cobblestone Ct
- 2100 Cobblestone Ct #101 Unit 101
- 2105 Timberdale Dr
- 308 Timberdale Terrace
- 1900 Cobblestone Ct
- 2100 Cobblestone Ct Unit 119
- 2100 Cobblestone Ct Unit 118
- 2100 Cobblestone Ct Unit 120
- 2100 Cobblestone Ct Unit 117
- 2100 Cobblestone Ct Unit 116
- 2100 Cobblestone Ct Unit 115
- 2100 Cobblestone Ct Unit 114
- 2100 Cobblestone Ct Unit 113