208 W 1600 N Layton, UT 84041
Estimated Value: $433,000 - $450,000
3
Beds
2
Baths
1,545
Sq Ft
$287/Sq Ft
Est. Value
About This Home
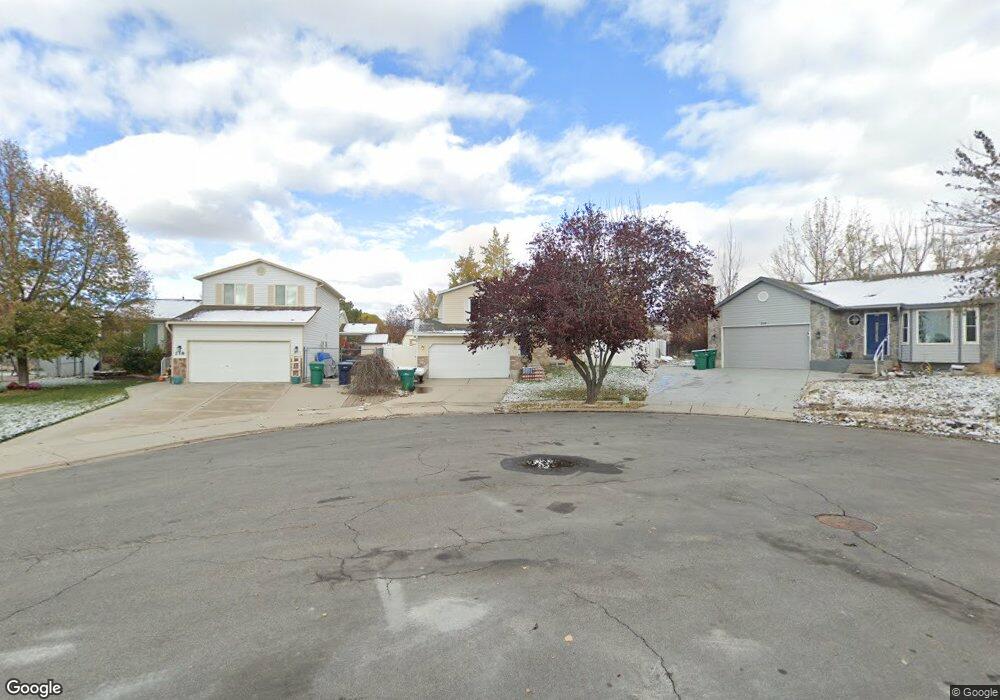
This home is located at 208 W 1600 N, Layton, UT 84041 and is currently estimated at $443,339, approximately $286 per square foot. 208 W 1600 N is a home located in Davis County with nearby schools including Lincoln Elementary School, North Layton Junior High School, and Northridge High School.
Ownership History
Date
Name
Owned For
Owner Type
Purchase Details
Closed on
Apr 10, 2023
Sold by
Larsen Lori L
Bought by
Jones Kenneth Campbell and Jones Makail Kaitlin
Current Estimated Value
Home Financials for this Owner
Home Financials are based on the most recent Mortgage that was taken out on this home.
Original Mortgage
$425,000
Outstanding Balance
$412,521
Interest Rate
6.5%
Mortgage Type
VA
Estimated Equity
$30,818
Purchase Details
Closed on
Oct 31, 2001
Sold by
White Jeffrey L and White Monica
Bought by
Larsen Lori L
Home Financials for this Owner
Home Financials are based on the most recent Mortgage that was taken out on this home.
Original Mortgage
$105,300
Interest Rate
6.84%
Purchase Details
Closed on
Apr 26, 2000
Sold by
Parker Monica
Bought by
White Jeffrey L and Parker Monica
Home Financials for this Owner
Home Financials are based on the most recent Mortgage that was taken out on this home.
Original Mortgage
$91,600
Interest Rate
8.24%
Create a Home Valuation Report for This Property
The Home Valuation Report is an in-depth analysis detailing your home's value as well as a comparison with similar homes in the area
Home Values in the Area
Average Home Value in this Area
Purchase History
| Date | Buyer | Sale Price | Title Company |
|---|---|---|---|
| Jones Kenneth Campbell | -- | None Listed On Document | |
| Larsen Lori L | -- | Equity Title Agency | |
| White Jeffrey L | -- | Bonneville Title Company Inc | |
| Parker Monica | -- | Bonneville Title Company Inc |
Source: Public Records
Mortgage History
| Date | Status | Borrower | Loan Amount |
|---|---|---|---|
| Open | Jones Kenneth Campbell | $425,000 | |
| Previous Owner | Larsen Lori L | $105,300 | |
| Previous Owner | Parker Monica | $91,600 |
Source: Public Records
Tax History Compared to Growth
Tax History
| Year | Tax Paid | Tax Assessment Tax Assessment Total Assessment is a certain percentage of the fair market value that is determined by local assessors to be the total taxable value of land and additions on the property. | Land | Improvement |
|---|---|---|---|---|
| 2025 | -- | $224,950 | $96,967 | $127,983 |
| 2024 | $2,044 | $217,250 | $113,567 | $103,683 |
| 2023 | $2,044 | $381,000 | $140,527 | $240,473 |
| 2022 | $1,896 | $191,950 | $72,641 | $119,309 |
| 2021 | $1,736 | $262,000 | $97,646 | $164,354 |
| 2020 | $1,561 | $226,000 | $83,931 | $142,069 |
| 2019 | $1,530 | $217,000 | $81,359 | $135,641 |
| 2018 | $1,369 | $195,000 | $81,359 | $113,641 |
| 2016 | $1,273 | $93,500 | $24,839 | $68,661 |
| 2015 | $1,208 | $84,205 | $24,839 | $59,366 |
| 2014 | $1,146 | $81,740 | $24,839 | $56,901 |
| 2013 | -- | $88,893 | $22,179 | $66,714 |
Source: Public Records
Map
Nearby Homes