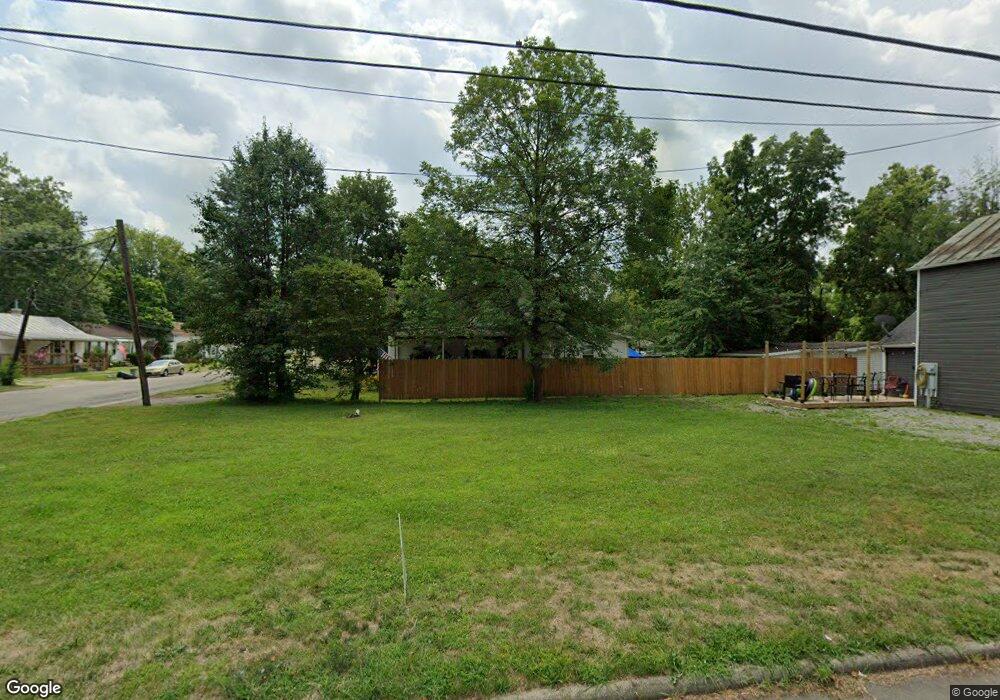
208 W Fancy St Blanchester, OH 45107
Estimated Value: $112,973 - $170,000
2
Beds
2
Baths
1,296
Sq Ft
$110/Sq Ft
Est. Value
About This Home
This home is located at 208 W Fancy St, Blanchester, OH 45107 and is currently estimated at $142,243, approximately $109 per square foot. 208 W Fancy St is a home located in Clinton County with nearby schools including Putman Elementary School, Blanchester Middle School, and Blanchester Intermediate School.
Ownership History
Date
Name
Owned For
Owner Type
Purchase Details
Closed on
Apr 12, 2024
Sold by
Dachshund Investments Llc and Ohio Limited Liability Company
Bought by
Hopkins Timothy William
Current Estimated Value
Home Financials for this Owner
Home Financials are based on the most recent Mortgage that was taken out on this home.
Original Mortgage
$7,250
Outstanding Balance
$7,142
Interest Rate
6.88%
Estimated Equity
$135,101
Purchase Details
Closed on
Feb 18, 2021
Sold by
Ervin Matthew F and Ervin Jennifer L
Bought by
Dachsund Investments Llc
Purchase Details
Closed on
Oct 24, 2006
Sold by
Tisch Peggie Ervin
Bought by
Ervin Matthew F and Ervin Jennifer L
Purchase Details
Closed on
Jun 22, 2005
Sold by
Elam Trevor and Elam Beth Ann
Bought by
Tisch Peggie Ervin
Purchase Details
Closed on
Jan 1, 1990
Bought by
Christian Baptist Church
Create a Home Valuation Report for This Property
The Home Valuation Report is an in-depth analysis detailing your home's value as well as a comparison with similar homes in the area
Home Values in the Area
Average Home Value in this Area
Purchase History
| Date | Buyer | Sale Price | Title Company |
|---|---|---|---|
| Hopkins Timothy William | -- | None Listed On Document | |
| Dachsund Investments Llc | -- | None Listed On Document | |
| Dachsund Investments Llc | $49,500 | None Available | |
| Ervin Matthew F | -- | -- | |
| Tisch Peggie Ervin | $99,166 | -- | |
| Christian Baptist Church | -- | -- |
Source: Public Records
Mortgage History
| Date | Status | Borrower | Loan Amount |
|---|---|---|---|
| Open | Hopkins Timothy William | $7,250 | |
| Open | Hopkins Timothy William | $137,750 |
Source: Public Records
Tax History Compared to Growth
Tax History
| Year | Tax Paid | Tax Assessment Tax Assessment Total Assessment is a certain percentage of the fair market value that is determined by local assessors to be the total taxable value of land and additions on the property. | Land | Improvement |
|---|---|---|---|---|
| 2024 | $887 | $23,140 | $3,750 | $19,390 |
| 2023 | $887 | $23,140 | $3,750 | $19,390 |
| 2022 | $986 | $14,700 | $3,230 | $11,470 |
| 2021 | $663 | $14,950 | $3,230 | $11,720 |
| 2020 | $661 | $14,950 | $3,230 | $11,720 |
| 2019 | $585 | $12,790 | $3,220 | $9,570 |
| 2018 | $587 | $12,790 | $3,220 | $9,570 |
| 2017 | $575 | $12,790 | $3,220 | $9,570 |
| 2016 | $546 | $12,710 | $3,220 | $9,490 |
| 2015 | $546 | $12,710 | $3,220 | $9,490 |
| 2013 | $563 | $12,710 | $3,220 | $9,490 |
Source: Public Records
Map
Nearby Homes
- 507 Bourbon St
- 124 Bourbon St
- 128 W Burroughs St
- 502 Railroad St
- 301 W Main St
- 107 Central Ave
- 503 S Broadway St
- 0 Ohio 123 Unit 11 938995
- 0 Ohio 123 Unit 1848086
- 305 W Main St
- 213 N Broadway St
- 304 Cherry St
- 504 Cherry St
- 416 N Broadway St
- 753 W Main St
- 221 S Vine St
- 477 N Columbus St
- 7478 Fairground Rd
- 217 Pansy Pike
- 9 Pansy Pike