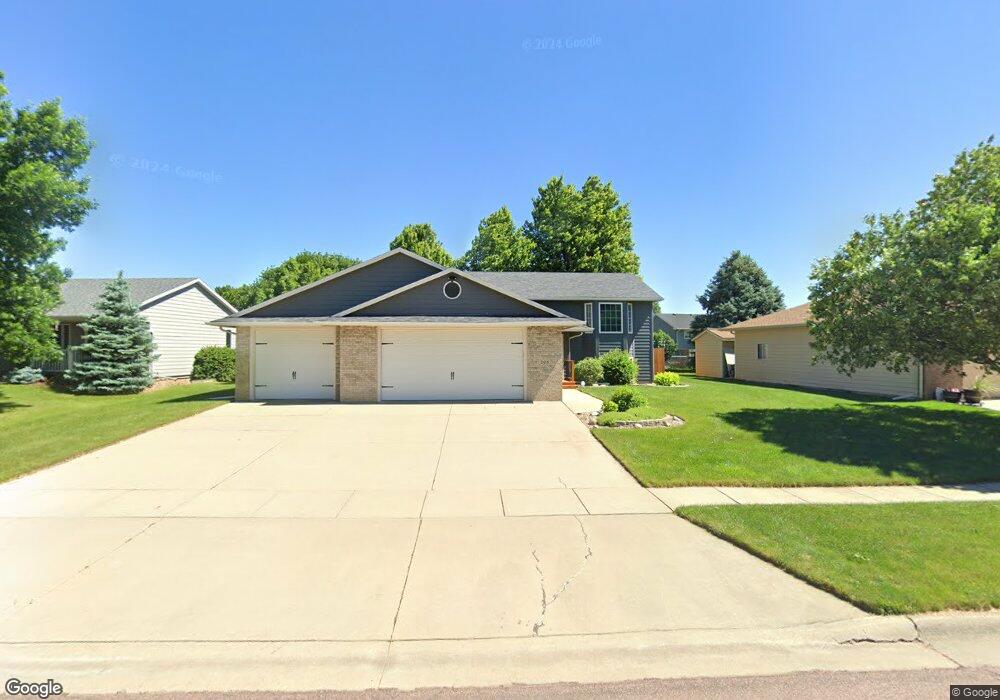
208 W Hackberry St Brandon, SD 57005
Estimated Value: $356,396 - $378,000
3
Beds
2
Baths
1,979
Sq Ft
$185/Sq Ft
Est. Value
About This Home
This home is located at 208 W Hackberry St, Brandon, SD 57005 and is currently estimated at $367,099, approximately $185 per square foot. 208 W Hackberry St is a home located in Minnehaha County with nearby schools including Robert Bennis Elementary School, Brandon Valley Intermediate School, and Brandon Valley Middle School.
Ownership History
Date
Name
Owned For
Owner Type
Purchase Details
Closed on
Apr 21, 2022
Sold by
Homer John Francis
Bought by
Stoterau Shane Carl and Stoterau Malorie Marie
Current Estimated Value
Home Financials for this Owner
Home Financials are based on the most recent Mortgage that was taken out on this home.
Original Mortgage
$305,600
Outstanding Balance
$287,565
Interest Rate
4.42%
Estimated Equity
$79,534
Purchase Details
Closed on
Feb 24, 2015
Sold by
Dean A Dean A and Kruger Deborah J
Bought by
Rollag Matthew and Rollag Megan
Home Financials for this Owner
Home Financials are based on the most recent Mortgage that was taken out on this home.
Original Mortgage
$200,396
Interest Rate
3.66%
Mortgage Type
New Conventional
Purchase Details
Closed on
Oct 2, 2013
Sold by
South Dakota Housing Development Authori
Bought by
Kruger Dean A and Kruger Deborah J
Purchase Details
Closed on
Sep 5, 2013
Sold by
Moe Brian M and City Of Brandon
Bought by
Milstead Mike and South Dakota Housing Developme
Create a Home Valuation Report for This Property
The Home Valuation Report is an in-depth analysis detailing your home's value as well as a comparison with similar homes in the area
Home Values in the Area
Average Home Value in this Area
Purchase History
| Date | Buyer | Sale Price | Title Company |
|---|---|---|---|
| Stoterau Shane Carl | $337,500 | -- | |
| Stoterau Shane Carl | $337,500 | -- | |
| Rollag Matthew | $197,000 | Getty Abstract & Title Compa | |
| Kruger Dean A | -- | -- | |
| Milstead Mike | -- | -- |
Source: Public Records
Mortgage History
| Date | Status | Borrower | Loan Amount |
|---|---|---|---|
| Open | Stoterau Shane Carl | $305,600 | |
| Closed | Stoterau Shane Carl | $305,600 | |
| Previous Owner | Rollag Matthew | $200,396 |
Source: Public Records
Tax History
| Year | Tax Paid | Tax Assessment Tax Assessment Total Assessment is a certain percentage of the fair market value that is determined by local assessors to be the total taxable value of land and additions on the property. | Land | Improvement |
|---|---|---|---|---|
| 2024 | $3,785 | $277,600 | $25,400 | $252,200 |
| 2023 | $4,054 | $283,400 | $25,400 | $258,000 |
| 2022 | $3,657 | $240,800 | $25,400 | $215,400 |
| 2021 | $3,132 | $211,500 | $0 | $0 |
| 2020 | $3,132 | $192,200 | $0 | $0 |
| 2019 | $3,006 | $180,388 | $0 | $0 |
| 2018 | $2,663 | $172,734 | $0 | $0 |
| 2017 | $2,668 | $158,964 | $26,040 | $132,924 |
| 2016 | $2,668 | $156,547 | $26,040 | $130,507 |
| 2015 | $3,300 | $149,854 | $24,180 | $125,674 |
| 2014 | $2,544 | $143,812 | $24,180 | $119,632 |
Source: Public Records
Map
Nearby Homes
- 209 W Ironwood St
- 216 Mountain Ash St
- 1700 Locust Ave
- 1812 Mulberry Ave Unit H
- 112 W Evergreen Dr
- 1205 S Moonlight Dr Dr
- 1208 S Moonlight Dr Dr
- 1204 S Moonlight Dr Dr
- 1200 S Moonlight Dr Dr
- 1113 S Moonlight Dr Dr
- 1116 S Moonlight Dr Dr
- 1109 S Moonlight Dr Dr
- 1112 S Moonlight Dr Dr
- 1121 S Oakland Cir
- 1101 S Oakland Cir
- 1113 S Oakland Cir
- 1125 S Oakland Cir
- 1204 S Oakland Cir
- 1208 S Oakland Cir
- 1200 S Oakland Cir
- 212 W Hackberry St
- 205 W Greenwood St
- 216 W Hackberry St
- 113 W Greenwood St
- 200 W Hackberry St
- 209 W Hackberry St
- 213 W Hackberry St
- 205 W Hackberry St
- 217 W Hackberry St
- 209 W Greenwood St
- 109 W Greenwood St
- 221 W Hackberry St
- 201 W Hackberry St
- 108 W Hackberry St
- 220 W Hackberry St
- 213 W Greenwood St
- 216 W Ironwood St
- 113 W Hackberry St
- 220 W Ironwood St
- 200 W Greenwood St
Your Personal Tour Guide
Ask me questions while you tour the home.