2080 Clayborn Ct Columbus, OH 43235
Brookside Colony NeighborhoodEstimated Value: $358,634 - $390,000
3
Beds
2
Baths
1,412
Sq Ft
$265/Sq Ft
Est. Value
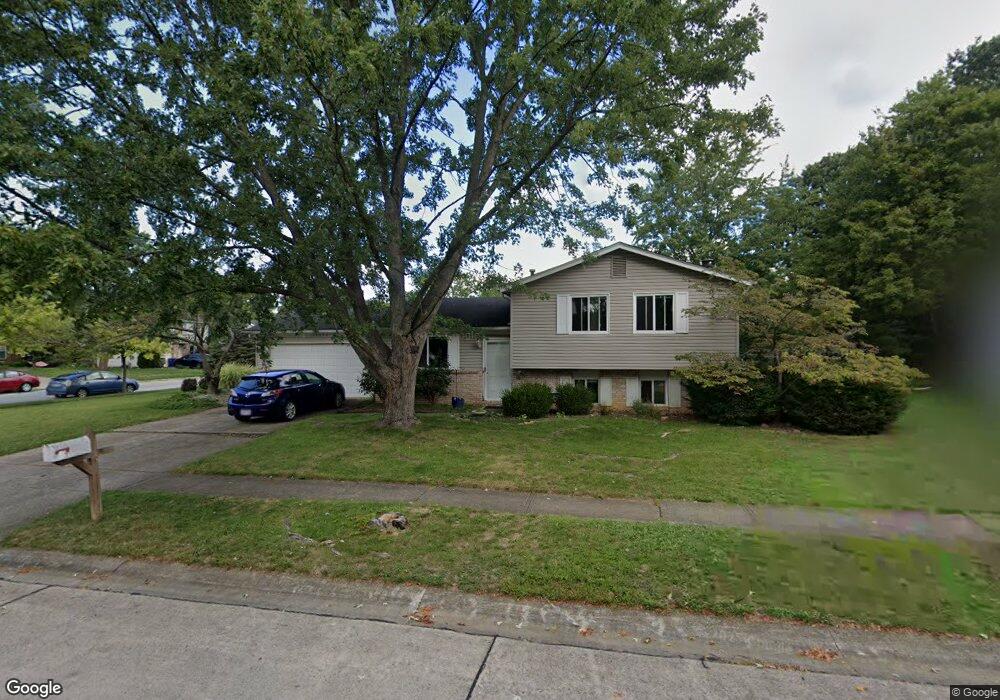
About This Home
This home is located at 2080 Clayborn Ct, Columbus, OH 43235 and is currently estimated at $373,909, approximately $264 per square foot. 2080 Clayborn Ct is a home located in Franklin County with nearby schools including Indian Run Elementary School, Ann Simpson Davis Middle School, and Dublin Scioto High School.
Ownership History
Date
Name
Owned For
Owner Type
Purchase Details
Closed on
May 8, 2009
Sold by
Gretz John A and Gretz Tammy S
Bought by
Hardman Paul R and Hardman Jill C
Current Estimated Value
Home Financials for this Owner
Home Financials are based on the most recent Mortgage that was taken out on this home.
Original Mortgage
$160,047
Outstanding Balance
$101,121
Interest Rate
4.85%
Mortgage Type
FHA
Estimated Equity
$272,788
Purchase Details
Closed on
Jun 25, 1999
Sold by
Kinsley Dale R and Kinsley Jacqueline A
Bought by
Gretz John A
Home Financials for this Owner
Home Financials are based on the most recent Mortgage that was taken out on this home.
Original Mortgage
$105,300
Interest Rate
5.99%
Purchase Details
Closed on
Feb 20, 1990
Bought by
Kinsley Dale R
Purchase Details
Closed on
Sep 1, 1981
Create a Home Valuation Report for This Property
The Home Valuation Report is an in-depth analysis detailing your home's value as well as a comparison with similar homes in the area
Home Values in the Area
Average Home Value in this Area
Purchase History
| Date | Buyer | Sale Price | Title Company |
|---|---|---|---|
| Hardman Paul R | $163,000 | Attorney | |
| Gretz John A | $117,000 | Chicago Title | |
| Kinsley Dale R | $82,000 | -- | |
| -- | $59,600 | -- |
Source: Public Records
Mortgage History
| Date | Status | Borrower | Loan Amount |
|---|---|---|---|
| Open | Hardman Paul R | $160,047 | |
| Closed | Gretz John A | $105,300 |
Source: Public Records
Tax History Compared to Growth
Tax History
| Year | Tax Paid | Tax Assessment Tax Assessment Total Assessment is a certain percentage of the fair market value that is determined by local assessors to be the total taxable value of land and additions on the property. | Land | Improvement |
|---|---|---|---|---|
| 2024 | $5,775 | $95,480 | $36,540 | $58,940 |
| 2023 | $5,693 | $95,480 | $36,540 | $58,940 |
| 2022 | $5,235 | $81,590 | $24,120 | $57,470 |
| 2021 | $5,320 | $81,590 | $24,120 | $57,470 |
| 2020 | $5,288 | $81,590 | $24,120 | $57,470 |
| 2019 | $4,866 | $66,470 | $20,090 | $46,380 |
| 2018 | $3,920 | $57,790 | $20,090 | $37,700 |
| 2017 | $3,906 | $57,790 | $20,090 | $37,700 |
| 2016 | $3,571 | $49,630 | $14,280 | $35,350 |
| 2015 | $3,594 | $49,630 | $14,280 | $35,350 |
| 2014 | $3,597 | $49,630 | $14,280 | $35,350 |
| 2013 | $1,826 | $49,630 | $14,280 | $35,350 |
Source: Public Records
Map
Nearby Homes
- 6921 Spruce Pine Dr
- 2056 Fincastle Ct
- 2161 Heatherfield Ave
- 1930 Shallowford Ave
- 7373 Palmleaf Ln
- 2001 Sawbury Blvd Unit 2001
- 1889 Slaton Ct Unit 1889
- 1721 Worthington Run Dr Unit 1721-1731
- 2687 Snouffer Rd
- 2392 Dunsworth Dr
- 1637 Park Row Dr Unit F
- 1620 Park Row Dr Unit A
- 2220 Surreygate Dr
- 1828 Gardenstone Dr
- 2533 Timberside Dr
- 2548 Timberside Dr Unit 2548
- 2546 Timberside Dr Unit 2546
- 2456 Sanford Dr
- 7385 Cimmaron Station
- 2074 Hard Rd
- 6856 Maybrook St
- 2072 Clayborn Ct
- 2079 Clayborn Ct
- 2077 Brofford Dr
- 2069 Brofford Dr
- 2064 Clayborn Ct
- 2071 Clayborn Ct
- 6847 Maybrook St
- 6855 Maybrook St
- 6839 Maybrook St
- 6863 Maybrook St
- 2061 Brofford Dr
- 6818 Maybrook St
- 2063 Clayborn Ct
- 6831 Maybrook St
- 6871 Maybrook St
- 2056 Clayborn Ct
- 6823 Maybrook St
- 2078 Brofford Dr
- 6879 Maybrook St