Estimated Value: $213,000 - $266,000
3
Beds
2
Baths
1,260
Sq Ft
$184/Sq Ft
Est. Value
About This Home
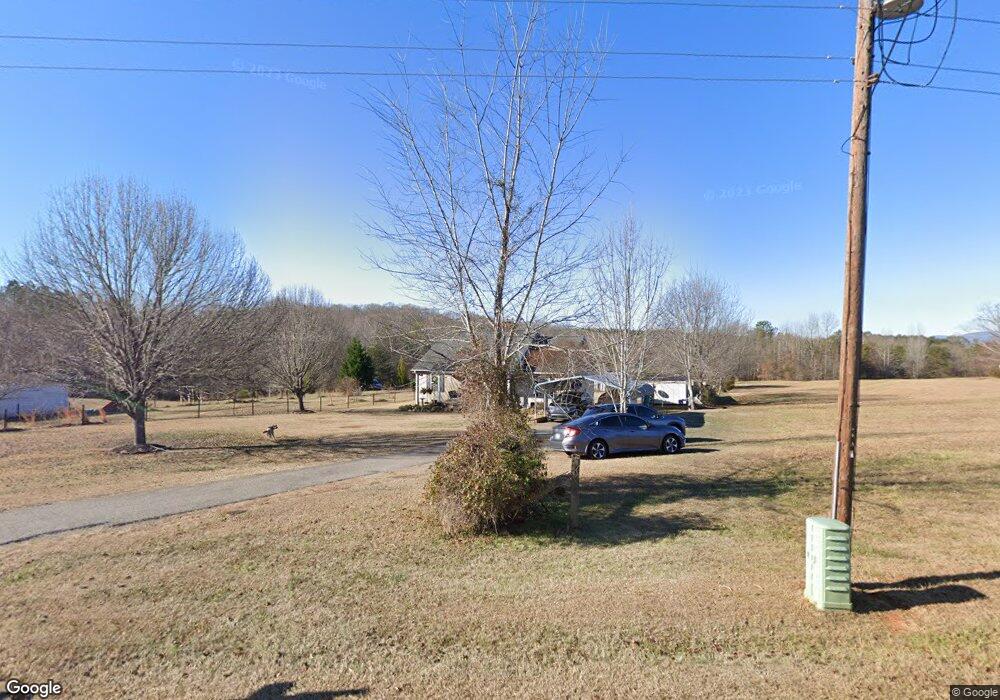
This home is located at 2080 Dickson Rd, Inman, SC 29349 and is currently estimated at $231,622, approximately $183 per square foot. 2080 Dickson Rd is a home located in Spartanburg County with nearby schools including Campobello-Gramling School and Chapman High School.
Ownership History
Date
Name
Owned For
Owner Type
Purchase Details
Closed on
Feb 23, 2024
Sold by
Ledbetter Richard I and Rankin Grace Isaaileen
Bought by
Cheek Monica Denise and Newman William Lee
Current Estimated Value
Purchase Details
Closed on
May 8, 2016
Sold by
Ledbetter Richard I and Ledbetter Richard I
Bought by
Ledbetter Richard and Ledbetter Grace
Purchase Details
Closed on
Jan 12, 2015
Sold by
Ledbetter Grace
Bought by
Ledbetter Richard and Ledbetter Grace
Purchase Details
Closed on
Mar 31, 2008
Sold by
Cheek Mike and Cheek Michael Allen
Bought by
Cheek Monica and Cheek Monica Denise
Purchase Details
Closed on
Nov 24, 2003
Sold by
Ledbetter Richard and Ledbetter Grace
Bought by
Cheek Mike and Cheek Monica
Home Financials for this Owner
Home Financials are based on the most recent Mortgage that was taken out on this home.
Original Mortgage
$80,000
Interest Rate
6%
Mortgage Type
Seller Take Back
Purchase Details
Closed on
May 19, 2003
Sold by
King Ralph D
Bought by
Ledbetter Richard and Ledbetter Grace
Create a Home Valuation Report for This Property
The Home Valuation Report is an in-depth analysis detailing your home's value as well as a comparison with similar homes in the area
Home Values in the Area
Average Home Value in this Area
Purchase History
| Date | Buyer | Sale Price | Title Company |
|---|---|---|---|
| Cheek Monica Denise | $87,000 | None Listed On Document | |
| Ledbetter Richard | -- | None Available | |
| Ledbetter Richard | -- | -- | |
| Cheek Monica | -- | None Available | |
| Cheek Mike | $87,000 | -- | |
| Ledbetter Richard | $10,000 | -- |
Source: Public Records
Mortgage History
| Date | Status | Borrower | Loan Amount |
|---|---|---|---|
| Previous Owner | Cheek Mike | $80,000 |
Source: Public Records
Tax History
| Year | Tax Paid | Tax Assessment Tax Assessment Total Assessment is a certain percentage of the fair market value that is determined by local assessors to be the total taxable value of land and additions on the property. | Land | Improvement |
|---|---|---|---|---|
| 2025 | $958 | $6,168 | $1,020 | $5,148 |
| 2024 | $958 | $5,132 | $849 | $4,283 |
| 2023 | $958 | $5,132 | $849 | $4,283 |
Source: Public Records
Map
Nearby Homes
- 1361 Hickory Nut Rd
- 2470 Old Mill Rd
- 473 Meadow Rd
- 255 Arena Park Dr
- 118 Sunset Dr
- 91 Orchard Dr
- 1080 Miller Farm Rd
- 345 Bishop Hicks Ct
- 135 Glendarosa Dr
- 150 Orchard Dr
- 00 State Road S-42-371
- 300 Beleshere Dr
- 118 Woodfin Dr
- 490 Hickory Nut Rd
- 180 Johnnys Rd
- 0 Foster Rd Unit SPN333119
- 304 Shoreham Ln
- 128 Cothran Rd
- 19 Mitchell Farm Rd
- 647 Narrow Cir
- 2086 Dickson Rd
- 2041 Dickson Rd
- 2082 Dickson Rd
- 2081 Dickson Rd
- 2090 Dickson Rd
- 2120 Dickson Rd
- 2096 Dickson Rd
- 2011 Dickson Rd
- 2136 Dickson Rd
- 2020 Dickson Rd
- 1585 Hickory Nut Rd
- 1600 Hickory Nut Rd
- 2151 Dickson Rd
- 2000 Dickson Rd
- 1495 Hickory Nut Rd
- 2121 Dickson Rd
- 2150 Dickson Rd
- 2180 Dickson Rd
- 247 Edwards Rd
- 2135 Dickson Rd
Your Personal Tour Guide
Ask me questions while you tour the home.