2080 Kings Gate Cir Unit A Snellville, GA 30078
Estimated Value: $157,410 - $187,000
3
Beds
2
Baths
1,172
Sq Ft
$150/Sq Ft
Est. Value
About This Home
This home is located at 2080 Kings Gate Cir Unit A, Snellville, GA 30078 and is currently estimated at $175,353, approximately $149 per square foot. 2080 Kings Gate Cir Unit A is a home located in Gwinnett County with nearby schools including Norton Elementary School, Snellville Middle School, and South Gwinnett High School.
Ownership History
Date
Name
Owned For
Owner Type
Purchase Details
Closed on
Dec 30, 2002
Sold by
Southern Creations Inc
Bought by
Pryce Marjorie H
Current Estimated Value
Home Financials for this Owner
Home Financials are based on the most recent Mortgage that was taken out on this home.
Original Mortgage
$136,754
Outstanding Balance
$58,681
Interest Rate
6.1%
Mortgage Type
FHA
Estimated Equity
$116,672
Purchase Details
Closed on
May 29, 2001
Sold by
Houston Jan S
Bought by
Moise Kim M
Home Financials for this Owner
Home Financials are based on the most recent Mortgage that was taken out on this home.
Original Mortgage
$73,600
Interest Rate
7.05%
Mortgage Type
New Conventional
Purchase Details
Closed on
May 8, 1998
Sold by
Johnson Doris
Bought by
Keenan Dolores A
Home Financials for this Owner
Home Financials are based on the most recent Mortgage that was taken out on this home.
Original Mortgage
$58,050
Interest Rate
7.1%
Mortgage Type
FHA
Create a Home Valuation Report for This Property
The Home Valuation Report is an in-depth analysis detailing your home's value as well as a comparison with similar homes in the area
Home Values in the Area
Average Home Value in this Area
Purchase History
| Date | Buyer | Sale Price | Title Company |
|---|---|---|---|
| Pryce Marjorie H | $138,900 | -- | |
| Moise Kim M | $73,600 | -- | |
| Keenan Dolores A | $64,500 | -- |
Source: Public Records
Mortgage History
| Date | Status | Borrower | Loan Amount |
|---|---|---|---|
| Open | Pryce Marjorie H | $136,754 | |
| Previous Owner | Moise Kim M | $73,600 | |
| Previous Owner | Keenan Dolores A | $58,050 |
Source: Public Records
Tax History Compared to Growth
Tax History
| Year | Tax Paid | Tax Assessment Tax Assessment Total Assessment is a certain percentage of the fair market value that is determined by local assessors to be the total taxable value of land and additions on the property. | Land | Improvement |
|---|---|---|---|---|
| 2024 | $1,930 | $60,320 | $12,000 | $48,320 |
| 2023 | $1,930 | $60,320 | $12,000 | $48,320 |
| 2022 | $1,231 | $38,360 | $8,000 | $30,360 |
| 2021 | $1,258 | $38,360 | $8,000 | $30,360 |
| 2020 | $1,173 | $31,160 | $6,000 | $25,160 |
| 2019 | $1,202 | $31,160 | $6,000 | $25,160 |
| 2018 | $1,119 | $28,840 | $6,000 | $22,840 |
| 2016 | $687 | $18,240 | $4,000 | $14,240 |
| 2015 | $491 | $18,240 | $4,000 | $14,240 |
| 2014 | $363 | $14,840 | $4,000 | $10,840 |
Source: Public Records
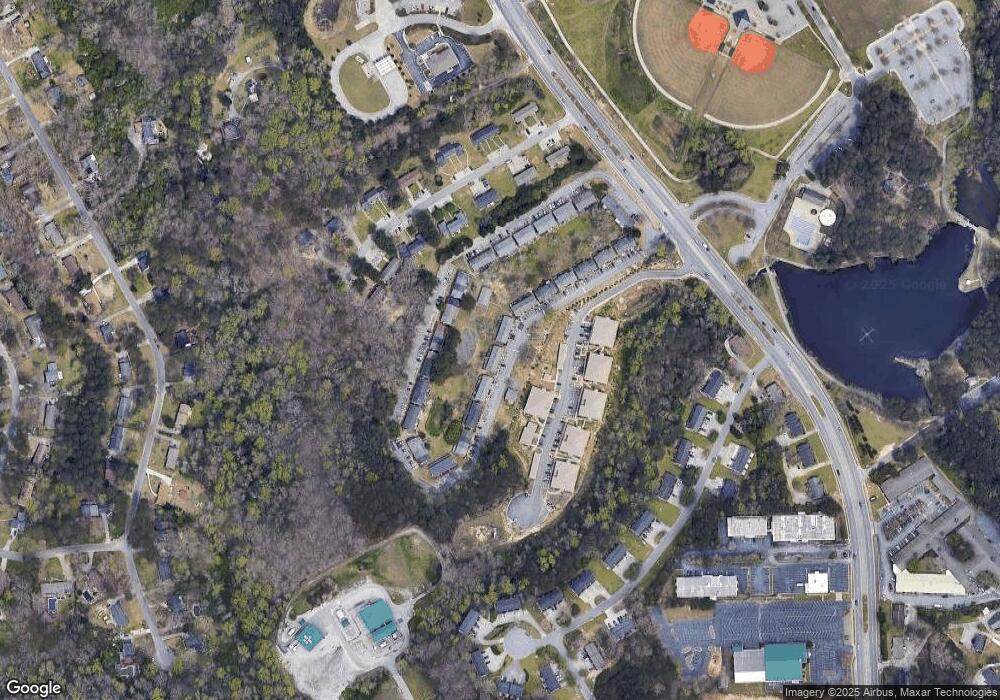
Map
Nearby Homes
- 2040 Kings Gate Cir Unit B
- 2200 Kings Gate Cir Unit D
- 2762 Hickory Trail
- 3079 Lenora Church Rd
- 2685 Lenora Church Rd
- 2887 Hickory Ln
- 2523 Meadowbrook Way
- 3107 Park Ln
- 2368 Ellis Ct
- 2405 Ivy Way
- 2554 Beal St
- 2484 Maple St
- 2604 Hickory Valley Dr
- 2433 Hidden Ln
- 2764 Eldorado Place
- 2260 Cedar Place Ct
- 3164 Yachet Ct SW
- 2759 Odum St
- 3136 Elizabeth Ln
- 2080 Kings Gate Cir Unit A
- 2080 Kings Gate Cir Unit D
- 2080 Kings Gate Cir
- 2080 Kings Gate Cir
- 2080 Kings Gate Cir Unit 1
- 2080 Kings Gate Cir
- 2080 Kings Gate Cir
- 2080 Kings Gate Cir Unit C
- 2070 Kings Gate Cir Unit C
- 2070 Kings Gate Cir Unit B
- 2070 Kings Gate Cir
- 2070 Kings Gate Cir
- 2070 Kings Gate Cir
- 2070 Kings Gate Cir Unit D
- 2090 Kings Gate Cir Unit 7-B
- 2090 Kings Gate Cir Unit B
- 2090 Kings Gate Cir Unit A
- 2090 Kings Gate Cir
- 2090 Kings Gate Cir
- 2090 Kings Gate Cir