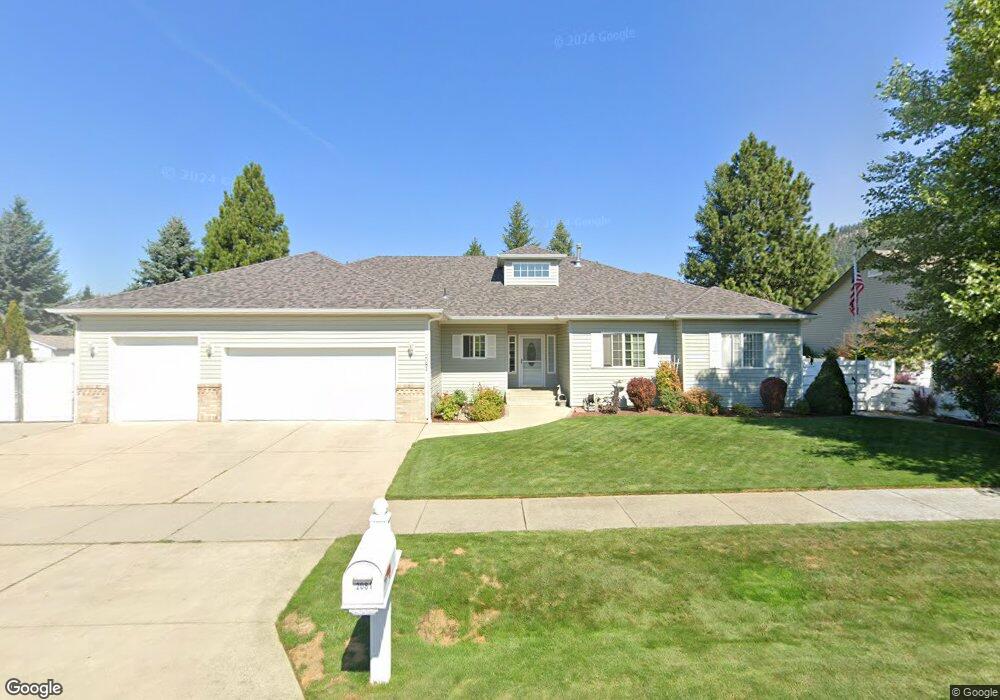
2081 E Briarleaf Ave Coeur D Alene, ID 83815
Northeast Prairie NeighborhoodEstimated Value: $904,010 - $970,000
6
Beds
3
Baths
4,102
Sq Ft
$228/Sq Ft
Est. Value
About This Home
This home is located at 2081 E Briarleaf Ave, Coeur D Alene, ID 83815 and is currently estimated at $937,253, approximately $228 per square foot. 2081 E Briarleaf Ave is a home located in Kootenai County with nearby schools including Bryan Elementary School, Canfield Middle School, and Coeur d'Alene High School.
Ownership History
Date
Name
Owned For
Owner Type
Purchase Details
Closed on
Jun 4, 2019
Sold by
Specht Charles Christian and Specht Dana Brunansky
Bought by
Costa Michael R and Costa Susan
Current Estimated Value
Home Financials for this Owner
Home Financials are based on the most recent Mortgage that was taken out on this home.
Original Mortgage
$448,000
Outstanding Balance
$393,083
Interest Rate
4.1%
Mortgage Type
New Conventional
Estimated Equity
$544,170
Purchase Details
Closed on
Feb 10, 2011
Sold by
Seaman Joseph Raymond and Seaman Lora Leanne
Bought by
Specht Dana B and Specht Charles C
Home Financials for this Owner
Home Financials are based on the most recent Mortgage that was taken out on this home.
Original Mortgage
$219,000
Interest Rate
4.84%
Mortgage Type
New Conventional
Purchase Details
Closed on
Dec 24, 2007
Sold by
Seaman Joseph Raymond and Seaman Lora Leanne
Bought by
Seaman Joseph Raymond and Seaman Lora Leanne
Create a Home Valuation Report for This Property
The Home Valuation Report is an in-depth analysis detailing your home's value as well as a comparison with similar homes in the area
Home Values in the Area
Average Home Value in this Area
Purchase History
| Date | Buyer | Sale Price | Title Company |
|---|---|---|---|
| Costa Michael R | -- | First American Ttl Kootenai | |
| Specht Dana B | -- | -- | |
| Seaman Joseph Raymond | -- | -- |
Source: Public Records
Mortgage History
| Date | Status | Borrower | Loan Amount |
|---|---|---|---|
| Open | Costa Michael R | $448,000 | |
| Previous Owner | Specht Dana B | $219,000 |
Source: Public Records
Tax History Compared to Growth
Tax History
| Year | Tax Paid | Tax Assessment Tax Assessment Total Assessment is a certain percentage of the fair market value that is determined by local assessors to be the total taxable value of land and additions on the property. | Land | Improvement |
|---|---|---|---|---|
| 2025 | $3,427 | $833,156 | $240,000 | $593,156 |
| 2024 | $3,427 | $824,708 | $225,000 | $599,708 |
| 2023 | $3,427 | $866,832 | $204,298 | $662,534 |
| 2022 | $4,429 | $971,422 | $240,350 | $731,072 |
| 2021 | $4,217 | $618,595 | $126,500 | $492,095 |
| 2020 | $3,947 | $550,546 | $115,000 | $435,546 |
| 2019 | $4,107 | $485,931 | $97,829 | $388,102 |
| 2018 | $4,062 | $441,749 | $88,935 | $352,814 |
| 2017 | $3,802 | $393,390 | $80,850 | $312,540 |
| 2016 | $3,738 | $368,440 | $73,500 | $294,940 |
| 2015 | $3,747 | $356,300 | $70,000 | $286,300 |
| 2013 | $3,245 | $291,520 | $45,540 | $245,980 |
Source: Public Records
Map
Nearby Homes
- 2066 E Goldleaf Ln
- 5189 Hague Ct
- 4404 N Huntercrest Dr
- 5519 N Wade St
- 4252 N Magnolia Dr
- 4860 N Cuprum Ct
- 5960 N 17th St
- 2153 E Thomas Hill Dr
- 1363 N Center Green Loop
- 1337 N Center Green Loop
- 3749 N Miners Loop
- 5687 N 15th St
- 5069 N Webster St
- 1283 N Center Green Loop
- 1213 E Fernwood Ct
- 1772 E Hanley Ave
- 3307 W Pine Hill Dr
- 850 E Trinity Ct
- 5155 N Ezy St
- 860 E Hoffman Ave
- 2105 E Briarleaf Ave
- 2055 E Briarleaf Ave
- 2082 E Greenleaf Ln
- 2082 Greenleaf Ave
- 2106 E Greenleaf Ln
- 2082 E Briarleaf Ave
- 2130 E Greenleaf Ln
- 2131 Briarleaf Ave
- 2130 Greenleaf Ave
- 2131 E Briarleaf Ave
- 2058 E Greenleaf Ln
- 2106 E Briarleaf Ave
- 2058 Greenleaf Ave
- 2056 Briarleaf Ave
- 2031 E Briarleaf Ave
- 2130 E Briarleaf Ave
- 2034 Greenleaf Ave
- 2154 E Greenleaf Ln
- 2032 E Briarleaf Ave
- 3032 E Briarleaf Ave