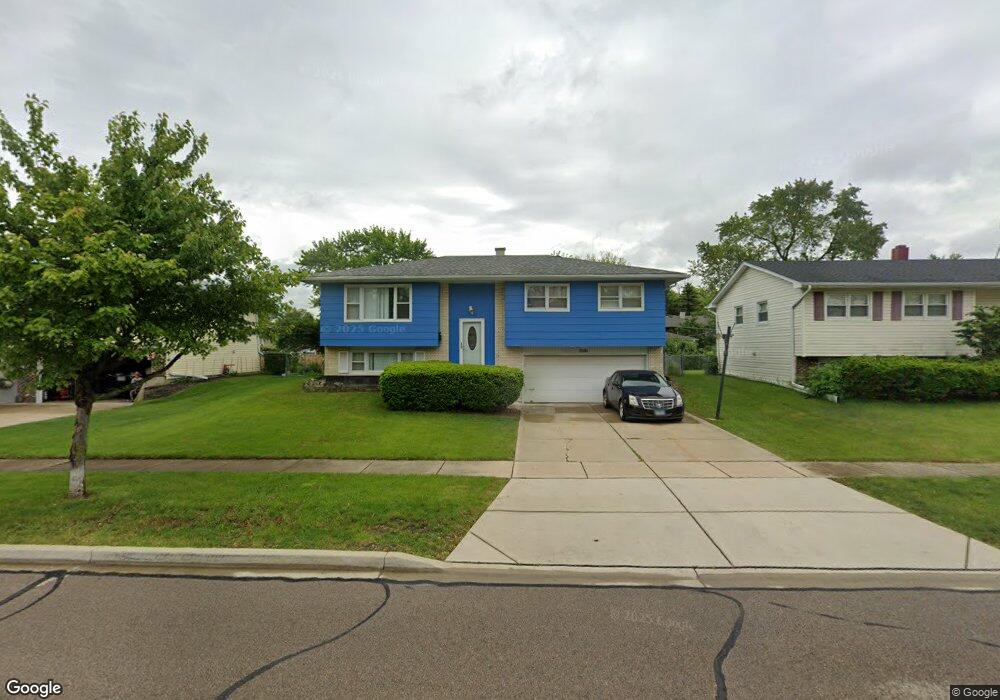
2081 Osage Ln Unit 3 Hanover Park, IL 60133
Estimated Value: $317,000 - $340,000
3
Beds
2
Baths
1,214
Sq Ft
$272/Sq Ft
Est. Value
About This Home
This home is located at 2081 Osage Ln Unit 3, Hanover Park, IL 60133 and is currently estimated at $329,621, approximately $271 per square foot. 2081 Osage Ln Unit 3 is a home located in Cook County with nearby schools including Parkwood Elementary School, Tefft Middle School, and Streamwood High School.
Ownership History
Date
Name
Owned For
Owner Type
Purchase Details
Closed on
Apr 23, 2007
Sold by
Montano Arturo
Bought by
Arteaga Graciela
Current Estimated Value
Home Financials for this Owner
Home Financials are based on the most recent Mortgage that was taken out on this home.
Original Mortgage
$164,000
Outstanding Balance
$109,573
Interest Rate
8.15%
Mortgage Type
Unknown
Estimated Equity
$220,048
Purchase Details
Closed on
Jul 8, 2003
Sold by
Arteaga Graciela and Perez Arias Reyes
Bought by
Montano Arturo
Home Financials for this Owner
Home Financials are based on the most recent Mortgage that was taken out on this home.
Original Mortgage
$160,000
Interest Rate
5.3%
Mortgage Type
Unknown
Purchase Details
Closed on
Feb 23, 2001
Sold by
Polka Frank E and Polka Angela
Bought by
Arteaga Graciela and Montano Arturo
Home Financials for this Owner
Home Financials are based on the most recent Mortgage that was taken out on this home.
Original Mortgage
$151,742
Interest Rate
7.13%
Mortgage Type
FHA
Create a Home Valuation Report for This Property
The Home Valuation Report is an in-depth analysis detailing your home's value as well as a comparison with similar homes in the area
Home Values in the Area
Average Home Value in this Area
Purchase History
| Date | Buyer | Sale Price | Title Company |
|---|---|---|---|
| Arteaga Graciela | -- | None Available | |
| Montano Arturo | -- | Metropolitan Title Co | |
| Arteaga Graciela | $169,500 | -- |
Source: Public Records
Mortgage History
| Date | Status | Borrower | Loan Amount |
|---|---|---|---|
| Open | Arteaga Graciela | $164,000 | |
| Previous Owner | Montano Arturo | $160,000 | |
| Previous Owner | Arteaga Graciela | $151,742 |
Source: Public Records
Tax History Compared to Growth
Tax History
| Year | Tax Paid | Tax Assessment Tax Assessment Total Assessment is a certain percentage of the fair market value that is determined by local assessors to be the total taxable value of land and additions on the property. | Land | Improvement |
|---|---|---|---|---|
| 2024 | $6,559 | $24,000 | $3,900 | $20,100 |
| 2023 | $6,357 | $24,000 | $3,900 | $20,100 |
| 2022 | $6,357 | $24,000 | $3,900 | $20,100 |
| 2021 | $6,570 | $20,643 | $2,730 | $17,913 |
| 2020 | $6,603 | $20,643 | $2,730 | $17,913 |
| 2019 | $6,574 | $22,937 | $2,730 | $20,207 |
| 2018 | $5,919 | $19,163 | $2,340 | $16,823 |
| 2017 | $5,884 | $19,163 | $2,340 | $16,823 |
| 2016 | $5,852 | $19,163 | $2,340 | $16,823 |
| 2015 | $5,573 | $17,169 | $2,145 | $15,024 |
| 2014 | $5,484 | $17,169 | $2,145 | $15,024 |
| 2013 | $5,286 | $17,169 | $2,145 | $15,024 |
Source: Public Records
Map
Nearby Homes
- 7411 Astor Ave
- 819 Robinson Ave
- 1516 Mckool Ave
- 7170 East Ave
- 905 Miller Ave
- 804 Bussey Ct
- 2040 Poplar Ave
- 7321 Jonquil Terrace
- 719 Lacy Ave
- 7211 Jonquil Terrace
- 821 Surrey Dr
- 1899 Redwood Ave
- 6988 Plumtree Ln
- 814 Surrey Dr
- 128 Sycamore Ave
- 1712 Poplar Ave
- 2110 Cherry Ave
- 1648 Linden Ave
- 617 Arnold Ave
- 202 Parkwood Dr
- 2091 Osage Ln
- 2071 Osage Ln
- 2080 Narcissus Ave
- 2101 Osage Ln
- 2061 Osage Ln
- 2070 Narcissus Ave
- 2090 Narcissus Ave
- 2080 Osage Ln
- 2100 Narcissus Ave Unit 3
- 2060 Narcissus Ave
- 2070 Osage Ln
- 2090 Osage Ln
- 2111 Osage Ln
- 2051 Osage Ln
- 2100 Osage Ln
- 2060 Osage Ln Unit 3
- 2110 Narcissus Ave
- 2050 Narcissus Ave
- 2121 Osage Ln
- 2110 Osage Ln