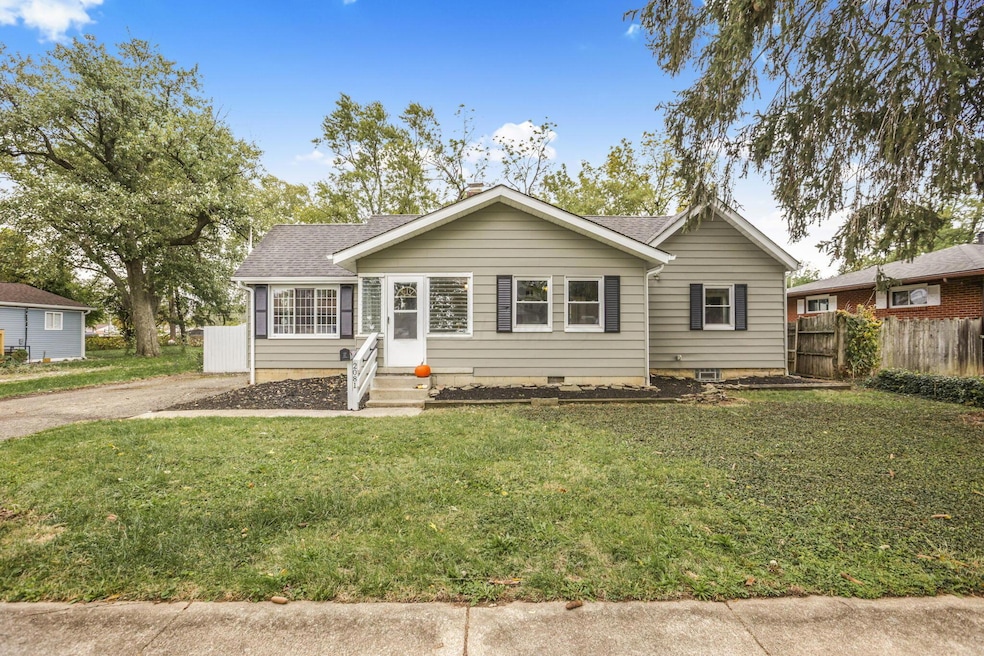
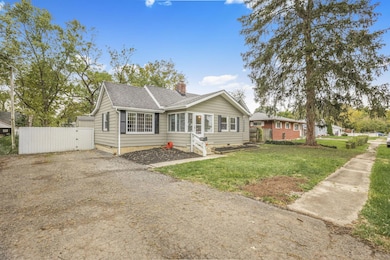
2081 Radnor Ave Columbus, OH 43224
North Linden NeighborhoodEstimated payment $1,217/month
Highlights
- Traditional Architecture
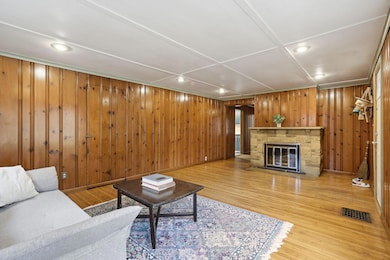
- 1 Fireplace
- No HOA
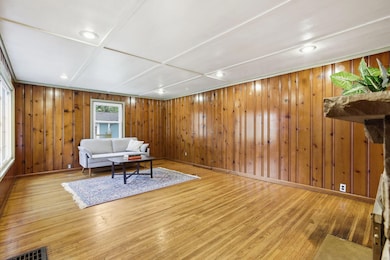
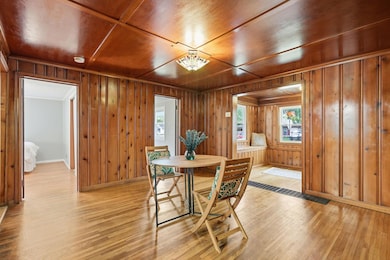
- Wood Flooring
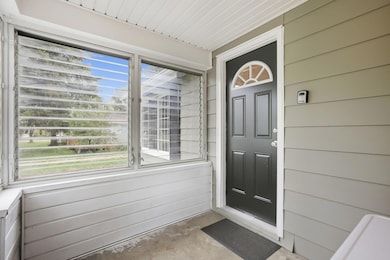
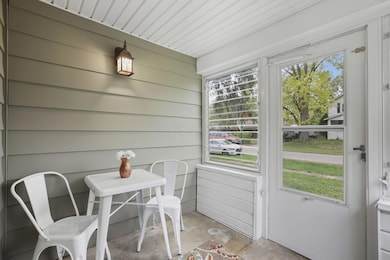
- Sun or Florida Room
- 4-minute walk to Clinton Township Veterans Park
About This Home
Updated and move-in ready 15 minutes from OSU, Easton and downtown! New roof, freshly painted exterior, updated HVAC, great big yard, and much more. Contact your realtor for the list of updates attached to this listing.
Listing Agent
KW Classic Properties Realty License #2016000794 Listed on: 10/23/2025

Home Details
Home Type
- Single Family
Est. Annual Taxes
- $2,905
Year Built
- Built in 1927
Lot Details
- 0.25 Acre Lot
- Property has an invisible fence for dogs
Home Design
- Traditional Architecture
- Block Foundation
- Aluminum Siding
Interior Spaces
- 1,198 Sq Ft Home
- 1-Story Property
- 1 Fireplace
- Insulated Windows
- Sun or Florida Room
- Screened Porch
- Wood Flooring
- Basement
- Crawl Space
- Gas Range
- Gas Dryer Hookup
Bedrooms and Bathrooms
- 2 Main Level Bedrooms
- 1 Full Bathroom
Parking
- On-Street Parking
- Off-Street Parking: 2
Outdoor Features
- Patio
Utilities
- Central Air
- Heating System Uses Gas
Community Details
- No Home Owners Association
Listing and Financial Details
- Assessor Parcel Number 130-000380
Map
Home Values in the Area
Average Home Value in this Area
Tax History
| Year | Tax Paid | Tax Assessment Tax Assessment Total Assessment is a certain percentage of the fair market value that is determined by local assessors to be the total taxable value of land and additions on the property. | Land | Improvement |
|---|---|---|---|---|
| 2024 | $2,905 | $49,320 | $11,730 | $37,590 |
| 2023 | $2,874 | $49,315 | $11,725 | $37,590 |
| 2022 | $2,189 | $29,410 | $7,950 | $21,460 |
| 2021 | $2,270 | $29,410 | $7,950 | $21,460 |
| 2020 | $2,195 | $29,410 | $7,950 | $21,460 |
| 2019 | $1,881 | $23,840 | $6,370 | $17,470 |
| 2018 | $1,597 | $23,840 | $6,370 | $17,470 |
| 2017 | $1,878 | $23,840 | $6,370 | $17,470 |
| 2016 | $1,508 | $17,290 | $4,480 | $12,810 |
| 2015 | $1,316 | $17,290 | $4,480 | $12,810 |
| 2014 | $1,318 | $17,290 | $4,480 | $12,810 |
| 2013 | $719 | $19,215 | $4,970 | $14,245 |
Property History
| Date | Event | Price | List to Sale | Price per Sq Ft |
|---|---|---|---|---|
| 10/23/2025 10/23/25 | For Sale | $185,000 | -- | $154 / Sq Ft |
Purchase History
| Date | Type | Sale Price | Title Company |
|---|---|---|---|
| Quit Claim Deed | -- | None Available | |
| Quit Claim Deed | $2,000 | None Available | |
| Warranty Deed | $47,900 | Title First Agency Inc | |
| Sheriffs Deed | $50,000 | -- | |
| Deed | -- | -- |
Mortgage History
| Date | Status | Loan Amount | Loan Type |
|---|---|---|---|
| Previous Owner | $45,505 | No Value Available |
Source: Columbus and Central Ohio Regional MLS
MLS Number: 225039934
APN: 130-000380
Disclaimer: Certain information contained herein is derived from information provided by parties other than Homes.com. All information provided is deemed reliable, but is not guaranteed to be accurate and should be independently verified.
![]() IDX information is provided exclusively for personal, non-commercial use, and may not be used for any purpose other than to identify prospective properties consumers may be interested in purchasing.
IDX information is provided exclusively for personal, non-commercial use, and may not be used for any purpose other than to identify prospective properties consumers may be interested in purchasing.
Information is deemed reliable but not guaranteed.
- 3685 Cleveland Ave
- 2015 Melrose Ave
- 2219 Sale Rd
- 2220 Sale Rd
- 1936 Case Rd
- 2023 Ferris Rd
- 1896 Ormond Ave
- 1997 Ferris Rd
- 1905 Elmore Ave
- 2283 Ward Rd
- 3609 Westerville Rd Unit P-49
- 4111 Walford St
- 3750 Dresden St
- 1863 Ward Rd
- 2194 Ashley Dr
- 4090 Cleveland Ave
- 2450 Winding Hills Ct Unit 2450
- 3591 Bremen St
- 2144 Colfax Ave
- 1734 Ferris Rd
- 3788 Cleveland Ave
- 3556 Greenwich St
- 3438 Calimero Dr
- 2414 Timber Trail Dr N
- 4371 Belcher Ct
- 4224 Concord Ln
- 4314 Dresden St
- 4370 Le Marie Ct
- 1699 Shanley Dr
- 3950 Karl Rd
- 3469 Nutcreek Ct Unit 471
- 1975 Dunbar Dr Unit E
- 4301 Goldengate Oval
- 3170 Cleveland Ave
- 4333 Chesford Rd
- 4565 Northland Square Dr E
- 2750 Arbury Ct
- 4426 Calderwood Dr
- 4621 Northtowne Blvd
- 4646 Tamarack Blvd