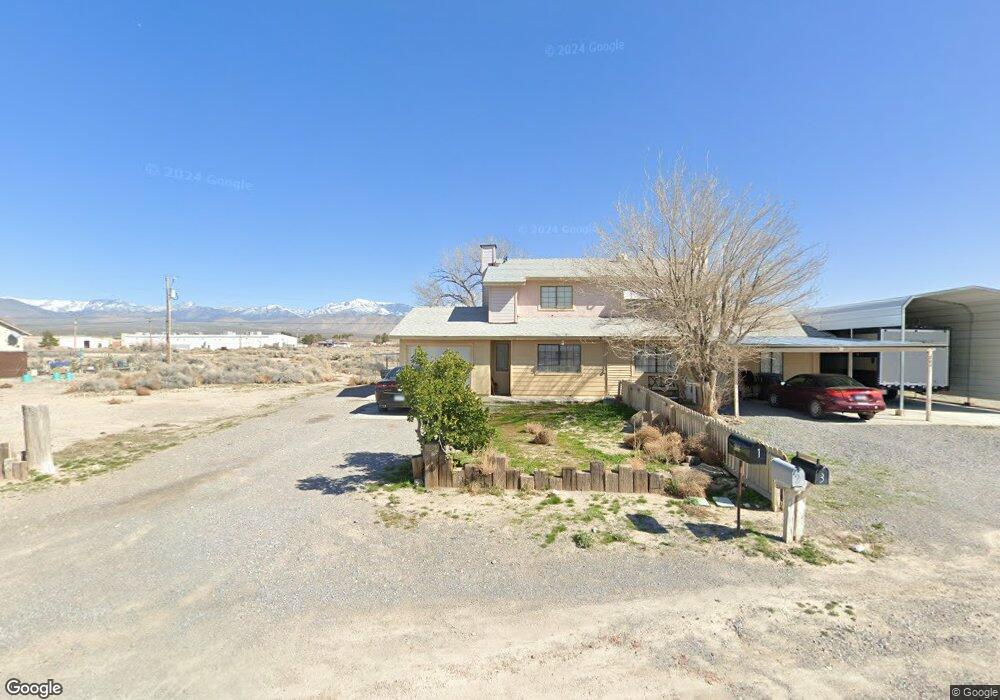
2081 Sycamore Ave Pahrump, NV 89048
Estimated Value: $284,000 - $310,000
--
Bed
--
Bath
3,397
Sq Ft
$86/Sq Ft
Est. Value
About This Home
This home is located at 2081 Sycamore Ave, Pahrump, NV 89048 and is currently estimated at $293,489, approximately $86 per square foot. 2081 Sycamore Ave is a home located in Nye County with nearby schools including J.G. Johnson Elementary School, Rosemary Clarke Middle School, and Pahrump Valley High School.
Ownership History
Date
Name
Owned For
Owner Type
Purchase Details
Closed on
Feb 28, 2015
Sold by
Huffman Robert Hughie and Huffman Marianida Nipa
Bought by
Ranger William A
Current Estimated Value
Purchase Details
Closed on
Nov 14, 2012
Sold by
Huffnian Robert H and Huffman Marianida N
Bought by
Huffman Robert and Huffman Marianida
Purchase Details
Closed on
Sep 24, 2012
Sold by
Huffman Robert H and Huffman Marianida N
Bought by
Huffman Robert H and Huffman Marianida N
Purchase Details
Closed on
Jun 7, 2012
Sold by
Stone Delvina P
Bought by
Huffman Robert and Huffman Marianida
Purchase Details
Closed on
May 9, 2012
Sold by
Best David L
Bought by
Stone Delvina P and The Robert L Stone & Delvina P Stone Fam
Purchase Details
Closed on
Nov 17, 2011
Sold by
Huffman Robert H and Huffman Marianida N
Bought by
Huffman Robert Hughie and Huffman Marianida H
Purchase Details
Closed on
Nov 21, 2006
Sold by
Huffman Robert H
Bought by
Huffman Robert H and Huffman Marianida N
Create a Home Valuation Report for This Property
The Home Valuation Report is an in-depth analysis detailing your home's value as well as a comparison with similar homes in the area
Home Values in the Area
Average Home Value in this Area
Purchase History
| Date | Buyer | Sale Price | Title Company |
|---|---|---|---|
| Ranger William A | $100,000 | First America Title | |
| Huffman Robert | -- | None Available | |
| Huffman Robert H | -- | None Available | |
| Huffman Robert | -- | None Available | |
| Huffman Robert | $20,000 | None Available | |
| Stone Delvina P | $42,925 | Chicago Title Of Nevada Inc | |
| Huffman Robert Hughie | -- | None Available | |
| Huffman Robert H | -- | None Available |
Source: Public Records
Tax History Compared to Growth
Tax History
| Year | Tax Paid | Tax Assessment Tax Assessment Total Assessment is a certain percentage of the fair market value that is determined by local assessors to be the total taxable value of land and additions on the property. | Land | Improvement |
|---|---|---|---|---|
| 2025 | $1,780 | $55,884 | $2,689 | $53,195 |
| 2024 | $1,780 | $59,084 | $2,689 | $56,395 |
| 2023 | $1,780 | $51,918 | $2,689 | $49,229 |
| 2022 | $1,530 | $49,159 | $2,689 | $46,470 |
| 2021 | $1,423 | $47,658 | $2,151 | $45,507 |
| 2020 | $1,368 | $50,961 | $2,151 | $48,810 |
| 2019 | $1,282 | $61,090 | $2,151 | $58,939 |
| 2018 | $1,225 | $58,709 | $1,721 | $56,988 |
| 2017 | $1,168 | $47,099 | $1,721 | $45,378 |
| 2016 | $1,140 | $33,303 | $1,721 | $31,582 |
| 2015 | $1,137 | $30,821 | $1,721 | $29,100 |
| 2014 | $1,103 | $33,643 | $2,046 | $31,597 |
Source: Public Records
Map
Nearby Homes
- 2011 Sycamore Ave Unit A
- 2181 S Highland Ave
- 1083 E Calvada Blvd
- 2070 S Nightingale Ave
- 2050 S Nightingale Ave
- 2230 S Nightingale Ave
- 1620 Pershing Ave
- 1970 Sycamore Ave
- 1991 S Highland Ave
- 2160 S Highland Ave
- 1220 E Calvada Blvd
- 2000 E Calvada Blvd
- 1090 Idaho St
- 881 E Calvada Blvd
- 1791 S Highland Ave
- 1920 Pahrump Valley Blvd
- 1300 Jacaranda St
- 2240 Jacaranda St
- 2081 Jacaranda St
- 961 Jacaranda St
- 2091 Sycamore Ave Unit 1
- 2091 Sycamore Ave
- 2091 Sycamore Ave Unit 2
- 2041 Sycamore Ave Unit 2
- 2041 Sycamore Ave
- 2041 Sycamore Ave Unit B
- 2041 Sycamore Ave Unit 1
- 2031 Sycamore Ave Unit 2031
- 2031 Sycamore Ave
- 2031 Sycamore Ave Unit A
- 1731 S Pershing Ct Unit B
- 2071 Galaxy St Unit B
- 2071 Galaxy St Unit 4B
- 2071 Galaxy St
- 2051 Galaxy St
- 2051 Galaxy St Unit A
- 2051 Galaxy St Unit B
- 2011 Sycamore Ave
- 2011 Sycamore Ave Unit B
- 2151 Galaxy St