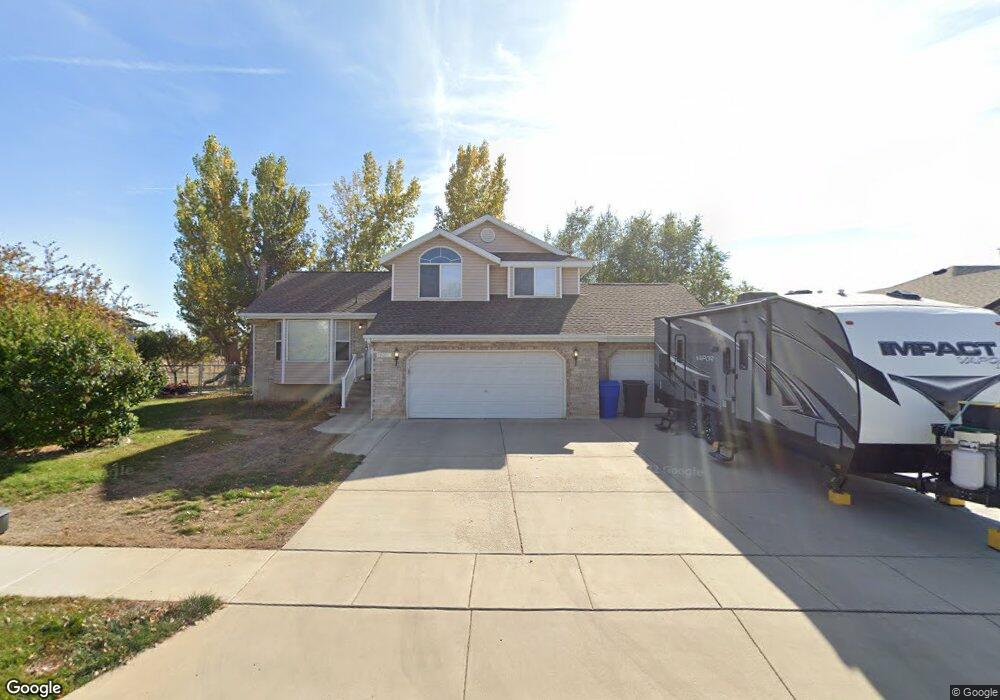
2081 W 470 N Clearfield, UT 84015
Estimated Value: $483,000 - $543,000
3
Beds
3
Baths
2,050
Sq Ft
$245/Sq Ft
Est. Value
About This Home
This home is located at 2081 W 470 N, Clearfield, UT 84015 and is currently estimated at $501,747, approximately $244 per square foot. 2081 W 470 N is a home located in Davis County with nearby schools including Lakeside School, West Point Junior High School, and Syracuse High School.
Ownership History
Date
Name
Owned For
Owner Type
Purchase Details
Closed on
Aug 17, 2021
Sold by
Coleman Jayne M and Coleman Clifford R
Bought by
Cross Austin Spencer and Cross Dana Nicole
Current Estimated Value
Home Financials for this Owner
Home Financials are based on the most recent Mortgage that was taken out on this home.
Original Mortgage
$365,040
Outstanding Balance
$331,434
Interest Rate
2.8%
Mortgage Type
VA
Estimated Equity
$170,313
Purchase Details
Closed on
Sep 19, 2003
Sold by
Bodily Dorthy T
Bought by
Coleman Clifford R and Coleman Jayne M
Home Financials for this Owner
Home Financials are based on the most recent Mortgage that was taken out on this home.
Original Mortgage
$163,000
Interest Rate
6.3%
Mortgage Type
VA
Purchase Details
Closed on
May 26, 1999
Sold by
Hatch Dorthy T
Bought by
Bodily Dorthy T
Purchase Details
Closed on
Jan 29, 1997
Sold by
Hatch Richard F
Bought by
Hatch Dorthy T
Purchase Details
Closed on
May 31, 1996
Sold by
Shepherd Scott R
Bought by
Hatch Richard F and Hatch Dorthy T
Create a Home Valuation Report for This Property
The Home Valuation Report is an in-depth analysis detailing your home's value as well as a comparison with similar homes in the area
Home Values in the Area
Average Home Value in this Area
Purchase History
| Date | Buyer | Sale Price | Title Company |
|---|---|---|---|
| Cross Austin Spencer | -- | Cottonwood Title | |
| Coleman Clifford R | -- | Bonneville Title Company Inc | |
| Bodily Dorthy T | -- | -- | |
| Hatch Dorthy T | -- | -- | |
| Hatch Richard F | -- | Bonneville Title Company Inc |
Source: Public Records
Mortgage History
| Date | Status | Borrower | Loan Amount |
|---|---|---|---|
| Open | Cross Austin Spencer | $365,040 | |
| Previous Owner | Coleman Clifford R | $163,000 |
Source: Public Records
Tax History Compared to Growth
Tax History
| Year | Tax Paid | Tax Assessment Tax Assessment Total Assessment is a certain percentage of the fair market value that is determined by local assessors to be the total taxable value of land and additions on the property. | Land | Improvement |
|---|---|---|---|---|
| 2025 | $2,770 | $259,600 | $101,834 | $157,766 |
| 2024 | $2,665 | $250,801 | $91,735 | $159,066 |
| 2023 | $2,454 | $425,000 | $111,129 | $313,871 |
| 2022 | $2,646 | $250,800 | $56,928 | $193,872 |
| 2021 | $2,299 | $326,000 | $92,388 | $233,612 |
| 2020 | $2,016 | $282,000 | $76,978 | $205,022 |
| 2019 | $1,928 | $266,000 | $74,872 | $191,128 |
| 2018 | $1,838 | $250,000 | $76,283 | $173,717 |
| 2016 | $1,640 | $117,370 | $29,454 | $87,916 |
| 2015 | $1,600 | $108,515 | $29,454 | $79,061 |
| 2014 | $1,427 | $98,094 | $29,454 | $68,640 |
| 2013 | -- | $87,480 | $28,215 | $59,265 |
Source: Public Records
Map
Nearby Homes
- 607 N 2000 W
- 2283 W 470 N
- 1774 W 400 N
- 2132 W 800 N
- 1805 W 675 N
- 1832 W 725 N
- 1827 W 775 N
- 2348 W 800 N
- 2535 W 550 N
- 1652 W 560 N
- 12 N 2000 W Unit 1
- 47 N 1750 W
- 1828 W 75 S
- 878 N 2600 W
- 575 N 1350 W Unit 137
- 1350 W 300 N Unit 49
- 1350 W 300 N Unit 38
- 1350 W 300 N Unit 29
- 563 N 1350 W Unit 139
- 1648 W 150 S