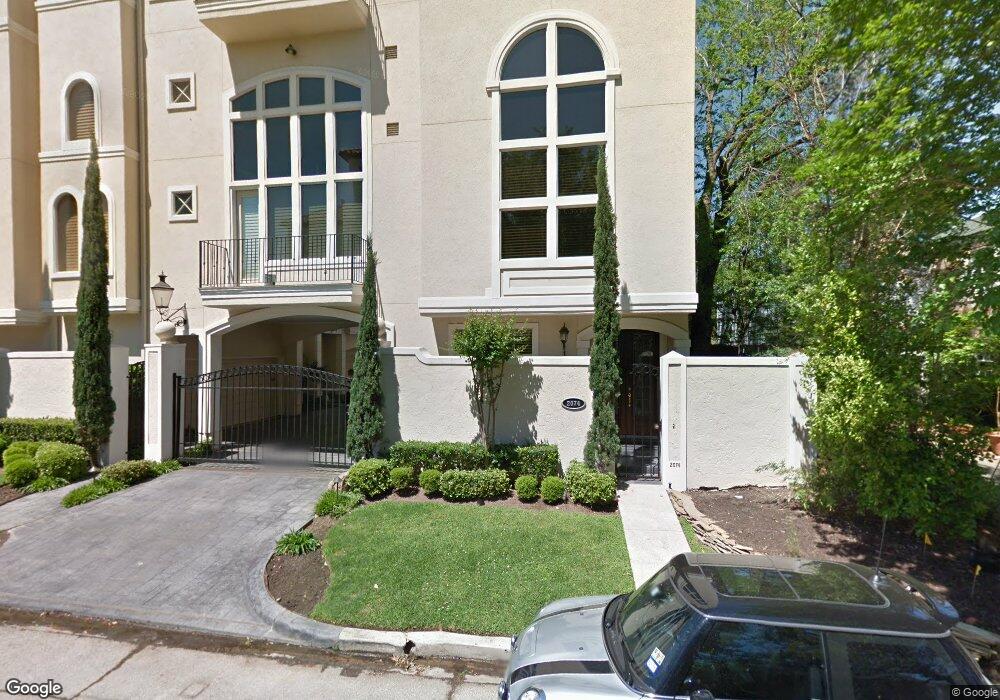
2082 Brentwood Dr Houston, TX 77019
Montrose NeighborhoodEstimated Value: $922,000 - $2,321,000
3
Beds
4
Baths
3,618
Sq Ft
$361/Sq Ft
Est. Value
About This Home
This home is located at 2082 Brentwood Dr, Houston, TX 77019 and is currently estimated at $1,304,519, approximately $360 per square foot. 2082 Brentwood Dr is a home located in Harris County with nearby schools including Baker Montessori, Lanier Middle School, and Lamar High School.
Ownership History
Date
Name
Owned For
Owner Type
Purchase Details
Closed on
Nov 10, 2015
Sold by
Jones Robert A
Bought by
Jones Robert Allen and Robert Allen Jones Revocable Living Trus
Current Estimated Value
Purchase Details
Closed on
Feb 28, 2014
Sold by
Jones Robert A
Bought by
Jones Robert A
Purchase Details
Closed on
Feb 25, 2011
Sold by
Lauret Linda Stanley and Lauret Thurman
Bought by
Jones Gaynelle and Jones Robert Allen
Home Financials for this Owner
Home Financials are based on the most recent Mortgage that was taken out on this home.
Original Mortgage
$448,000
Interest Rate
4.7%
Mortgage Type
New Conventional
Purchase Details
Closed on
Apr 25, 2001
Sold by
Norstone Ltd
Bought by
Stanley Linda R
Home Financials for this Owner
Home Financials are based on the most recent Mortgage that was taken out on this home.
Original Mortgage
$439,200
Interest Rate
6.81%
Create a Home Valuation Report for This Property
The Home Valuation Report is an in-depth analysis detailing your home's value as well as a comparison with similar homes in the area
Home Values in the Area
Average Home Value in this Area
Purchase History
| Date | Buyer | Sale Price | Title Company |
|---|---|---|---|
| Jones Robert Allen | -- | Attorney | |
| Jones Robert A | -- | None Available | |
| Jones Gaynelle | -- | Title Solutions Llc | |
| Stanley Linda R | -- | Alamo Title Company |
Source: Public Records
Mortgage History
| Date | Status | Borrower | Loan Amount |
|---|---|---|---|
| Previous Owner | Jones Gaynelle | $448,000 | |
| Previous Owner | Stanley Linda R | $439,200 |
Source: Public Records
Tax History Compared to Growth
Tax History
| Year | Tax Paid | Tax Assessment Tax Assessment Total Assessment is a certain percentage of the fair market value that is determined by local assessors to be the total taxable value of land and additions on the property. | Land | Improvement |
|---|---|---|---|---|
| 2025 | $6,960 | $854,666 | $222,200 | $632,466 |
| 2024 | $6,960 | $789,947 | $222,200 | $567,747 |
| 2023 | $6,960 | $797,619 | $222,200 | $575,419 |
| 2022 | $15,830 | $718,941 | $222,200 | $496,741 |
| 2021 | $15,917 | $682,929 | $212,100 | $470,829 |
| 2020 | $16,636 | $686,999 | $212,100 | $474,899 |
| 2019 | $18,542 | $732,756 | $130,800 | $601,956 |
| 2018 | $11,357 | $790,000 | $130,800 | $659,200 |
| 2017 | $41,926 | $790,000 | $130,800 | $659,200 |
| 2016 | $20,963 | $790,000 | $130,800 | $659,200 |
| 2015 | $11,798 | $790,000 | $130,800 | $659,200 |
| 2014 | $11,798 | $750,000 | $114,450 | $635,550 |
Source: Public Records
Map
Nearby Homes
- 1216 S Shepherd Dr
- 2116 Looscan Ln
- 2117 Chilton Rd
- 1201 Mcduffie St Unit 198
- 1025 S Shepherd Dr Unit 209
- 2131 Brentwood Dr
- 1005 S Shepherd Dr Unit 406
- 1005 S Shepherd Dr Unit 304
- 2247 Chilton Rd
- 1601 S Shepherd Dr Unit 20
- 1601 S Shepherd Dr Unit 29
- 1601 S Shepherd Dr Unit 138
- 2105 Del Monte Dr
- 1509 Mcduffie St
- 2204 Inwood Dr
- 902 S Shepherd Dr
- 1606 Hazard St
- 1510 Morse St
- 1711 Huldy St Unit A
- 1712 Mcduffie St
- 2086 Brentwood Dr
- 1309 S Shepherd Dr Unit 2
- 2078 Brentwood Dr
- 2090 Brentwood Dr
- 2074 Brentwood Dr
- 1305 S Shepherd Dr
- 2070 Brentwood Dr
- 2062 Brentwood Dr
- 1221 S Shepherd Dr
- 211 Pine Valley Dr
- 2101 Pine Valley Dr
- 2058 Brentwood Dr
- 2075 Brentwood Dr Unit A
- 2075 Brentwood Dr Unit B
- 2075 Brentwood Dr Unit C
- 2075 Brentwood Dr
- 1219 S Shepherd Dr
- 2104 Brentwood Dr
- 2071 Brentwood Dr
- 1307 Denman Rd