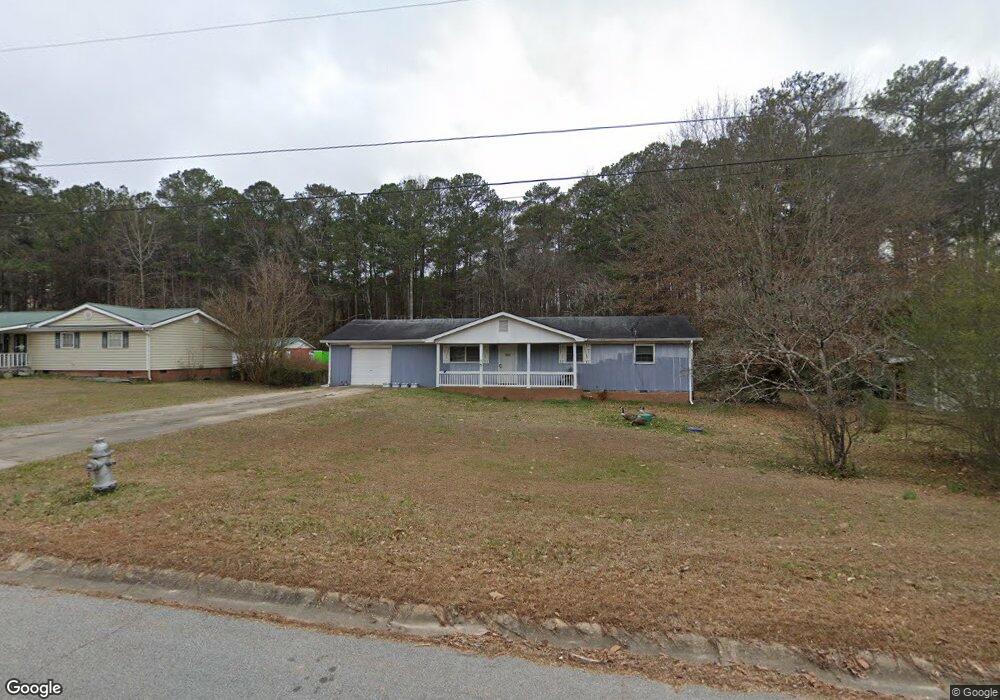
2082 Chestnut Start Dr Unit 7 Lithia Springs, GA 30122
Lithia Springs NeighborhoodEstimated Value: $147,000 - $208,000
3
Beds
2
Baths
1,176
Sq Ft
$154/Sq Ft
Est. Value
About This Home
This home is located at 2082 Chestnut Start Dr Unit 7, Lithia Springs, GA 30122 and is currently estimated at $180,970, approximately $153 per square foot. 2082 Chestnut Start Dr Unit 7 is a home located in Douglas County with nearby schools including Sweetwater Elementary School, Factory Shoals Middle School, and Lithia Springs Comprehensive High School.
Ownership History
Date
Name
Owned For
Owner Type
Purchase Details
Closed on
Apr 14, 2021
Sold by
Oman Lloyd John
Bought by
Mclean Timothy George
Current Estimated Value
Home Financials for this Owner
Home Financials are based on the most recent Mortgage that was taken out on this home.
Original Mortgage
$88,369
Outstanding Balance
$79,787
Interest Rate
3%
Mortgage Type
FHA
Estimated Equity
$101,184
Purchase Details
Closed on
Aug 18, 2005
Sold by
Johnson Curtis L
Bought by
Oman Lloyd J
Purchase Details
Closed on
Mar 12, 2002
Sold by
Farmer Kristy
Bought by
Johnson Curtis L
Purchase Details
Closed on
Mar 29, 1996
Sold by
Turner David N
Bought by
Johnson Curtis and Farmer Kristy
Create a Home Valuation Report for This Property
The Home Valuation Report is an in-depth analysis detailing your home's value as well as a comparison with similar homes in the area
Home Values in the Area
Average Home Value in this Area
Purchase History
| Date | Buyer | Sale Price | Title Company |
|---|---|---|---|
| Mclean Timothy George | $90,000 | -- | |
| Oman Lloyd J | -- | -- | |
| Johnson Curtis L | -- | -- | |
| Johnson Curtis | $64,900 | -- |
Source: Public Records
Mortgage History
| Date | Status | Borrower | Loan Amount |
|---|---|---|---|
| Open | Mclean Timothy George | $88,369 |
Source: Public Records
Tax History Compared to Growth
Tax History
| Year | Tax Paid | Tax Assessment Tax Assessment Total Assessment is a certain percentage of the fair market value that is determined by local assessors to be the total taxable value of land and additions on the property. | Land | Improvement |
|---|---|---|---|---|
| 2024 | $2,216 | $70,440 | $18,000 | $52,440 |
| 2023 | $2,216 | $70,440 | $18,000 | $52,440 |
| 2022 | $1,172 | $51,960 | $18,000 | $33,960 |
| 2021 | $1,229 | $37,680 | $12,000 | $25,680 |
| 2020 | $1,250 | $37,680 | $12,000 | $25,680 |
| 2019 | $873 | $28,200 | $9,240 | $18,960 |
| 2018 | $749 | $24,080 | $8,040 | $16,040 |
| 2017 | $697 | $21,960 | $8,040 | $13,920 |
| 2016 | $829 | $25,680 | $9,600 | $16,080 |
| 2015 | $732 | $22,200 | $8,520 | $13,680 |
| 2014 | $718 | $21,356 | $8,640 | $12,716 |
| 2013 | -- | $23,720 | $9,600 | $14,120 |
Source: Public Records
Map
Nearby Homes
- 2499 Chestnut Log Loop
- 2322 Chestnut Log Loop
- 3570 Briar Dr
- 1940 Lee
- LOT 27 Chestnut Ln
- 8684 Hickory Ln
- 3646 Briar Dr
- 2275 Chestnut Log Loop
- 3652 Sweetbriar Cir
- 3686 Sweetbriar Cir
- 3790 Sweetbriar Cir
- HAYDEN Plan at Fairhaven
- GREEN Plan at Fairhaven
- CALI Plan at Fairhaven
- ELLE Plan at Fairhaven
- PENWELL Plan at Fairhaven
- 1815 Lee Rd
- 3460 Meadowview Dr
- 3552 Meadowview Dr
- 3948 Fairhaven Rd
- 2072 Chestnut Start Dr Unit 7
- 2092 Chestnut Start Dr
- 2062 Chestnut Start Dr
- 2102 Chestnut Start Dr Unit 7
- 2081 Chestnut Start Dr Unit 7
- 2071 Chestnut Start Dr
- 2091 Chestnut Start Dr
- 2112 Chestnut Start Dr
- 2061 Chestnut Start Dr
- 2101 Chestnut Start Dr
- 2480 Chestnut Log Loop
- 2470 Chestnut Log Loop
- 2490 Chestnut Log Loop
- 2051 Chestnut Start Dr
- 2111 Chestnut Start Dr
- 2122 Chestnut Start Dr
- 2500 Chestnut Log Loop
- 2041 Chestnut Start Dr
- 2514 Chestnut Log Loop
- 2134 Chestnut Start Dr Unit 7