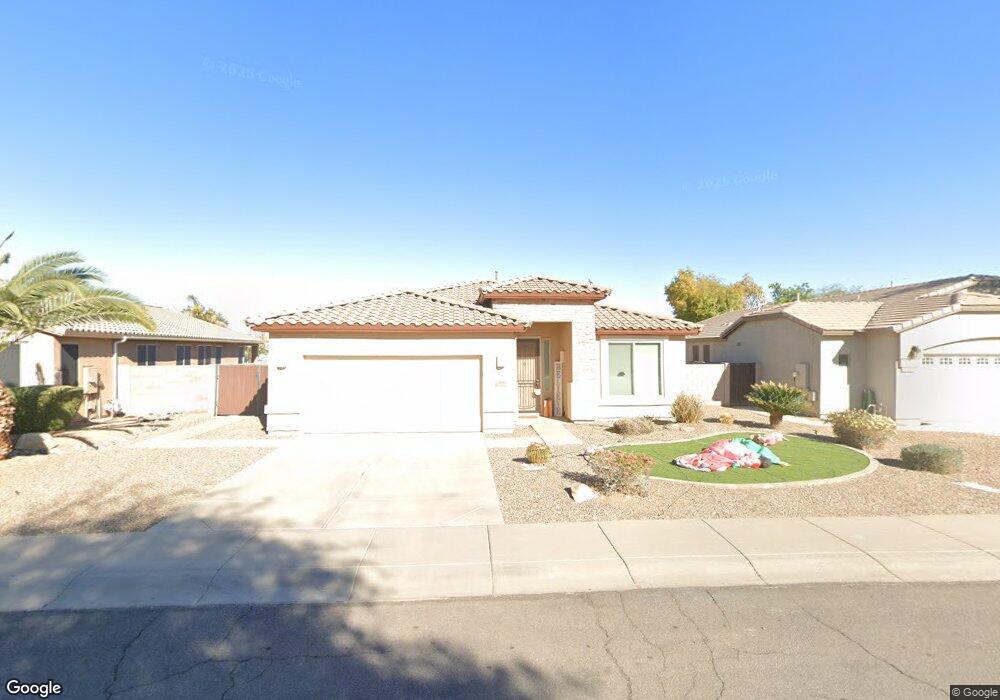
2082 E Torrey Pines Place Chandler, AZ 85249
South Chandler NeighborhoodEstimated Value: $556,136 - $598,000
3
Beds
2
Baths
2,159
Sq Ft
$265/Sq Ft
Est. Value
About This Home
This home is located at 2082 E Torrey Pines Place, Chandler, AZ 85249 and is currently estimated at $572,534, approximately $265 per square foot. 2082 E Torrey Pines Place is a home located in Maricopa County with nearby schools including Jane D. Hull Elementary School, Santan Junior High School, and BASIS Chandler Primary South Campus.
Ownership History
Date
Name
Owned For
Owner Type
Purchase Details
Closed on
Feb 24, 2011
Sold by
Federal Home Loan Mortgage Corporation
Bought by
Herpin Michael L and Herpin Rachel A
Current Estimated Value
Home Financials for this Owner
Home Financials are based on the most recent Mortgage that was taken out on this home.
Original Mortgage
$170,563
Outstanding Balance
$118,456
Interest Rate
5.02%
Mortgage Type
FHA
Estimated Equity
$454,079
Purchase Details
Closed on
Nov 30, 2010
Sold by
Hettrich Andrew J and Hettrich Natalie
Bought by
Federal Home Loan Mortgage Corp
Purchase Details
Closed on
Feb 2, 2000
Sold by
First American Title Insurance Company
Bought by
Hettrich Andrew J and Hettrich Natalie
Home Financials for this Owner
Home Financials are based on the most recent Mortgage that was taken out on this home.
Original Mortgage
$142,170
Interest Rate
8.16%
Mortgage Type
New Conventional
Create a Home Valuation Report for This Property
The Home Valuation Report is an in-depth analysis detailing your home's value as well as a comparison with similar homes in the area
Home Values in the Area
Average Home Value in this Area
Purchase History
| Date | Buyer | Sale Price | Title Company |
|---|---|---|---|
| Herpin Michael L | $175,000 | First American Title Ins Co | |
| Federal Home Loan Mortgage Corp | $187,000 | Security Title Agency | |
| Hettrich Andrew J | $157,966 | First American Title |
Source: Public Records
Mortgage History
| Date | Status | Borrower | Loan Amount |
|---|---|---|---|
| Open | Herpin Michael L | $170,563 | |
| Previous Owner | Hettrich Andrew J | $142,170 |
Source: Public Records
Tax History Compared to Growth
Tax History
| Year | Tax Paid | Tax Assessment Tax Assessment Total Assessment is a certain percentage of the fair market value that is determined by local assessors to be the total taxable value of land and additions on the property. | Land | Improvement |
|---|---|---|---|---|
| 2025 | $2,079 | $26,170 | -- | -- |
| 2024 | $2,009 | $24,924 | -- | -- |
| 2023 | $2,009 | $42,850 | $8,570 | $34,280 |
| 2022 | $1,940 | $31,960 | $6,390 | $25,570 |
| 2021 | $2,025 | $29,560 | $5,910 | $23,650 |
| 2020 | $2,014 | $27,910 | $5,580 | $22,330 |
| 2019 | $1,939 | $25,380 | $5,070 | $20,310 |
| 2018 | $1,875 | $23,710 | $4,740 | $18,970 |
| 2017 | $1,750 | $22,310 | $4,460 | $17,850 |
| 2016 | $1,686 | $21,900 | $4,380 | $17,520 |
| 2015 | $1,631 | $20,370 | $4,070 | $16,300 |
Source: Public Records
Map
Nearby Homes
- 2171 E Augusta Ave
- 2145 E Gemini Place
- 2283 E Torrey Pines Place
- 1930 E Sagittarius Place
- Plan 6004 at Symmetry at Magnolia
- Plan 6002 at Symmetry at Magnolia
- Plan 6001 at Symmetry at Magnolia
- Plan 6003 at Symmetry at Magnolia
- 1890 E Sagittarius Place
- 1871 E Sagittarius Place
- 6114 S Sawgrass Dr
- 6412 S Oakmont Dr
- 2055 E Indian Wells Dr
- 2311 E Aquarius Place
- 2331 E Aquarius Place
- 1937 E Victoria St
- 2300 E Aquarius Place
- 6249 S Championship Dr
- 1640 E Augusta Ave
- 2209 E Leo Place
- 2072 E Torrey Pines Place
- 2092 E Torrey Pines Place
- 2062 E Torrey Pines Place
- 2081 E Augusta Ave
- 2071 E Augusta Ave
- 2101 E Augusta Ave
- 2111 E Augusta Ave
- 2061 E Augusta Ave
- 2073 E Torrey Pines Place
- 2093 E Torrey Pines Place
- 2052 E Torrey Pines Place
- 2063 E Torrey Pines Place
- 6091 S Valerie Dr
- 2051 E Augusta Ave
- 2113 E Torrey Pines Place
- 2053 E Torrey Pines Place
- 6081 S Valerie Dr
- 2042 E Torrey Pines Place
- 2041 E Augusta Ave
- 2080 E Augusta Ave