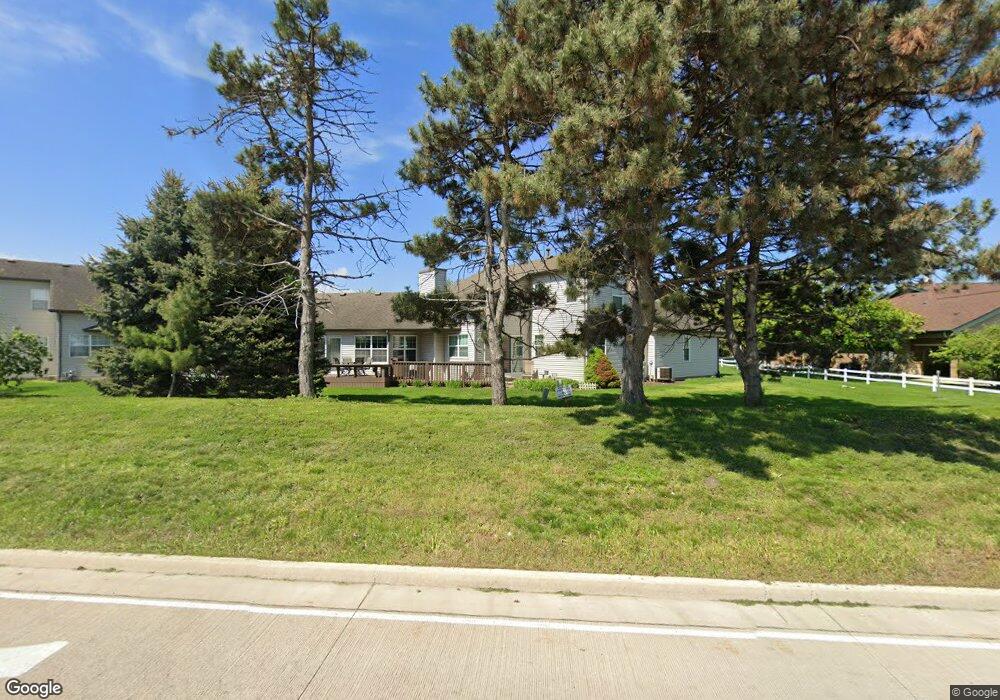
20823 W Torrey Pines Ln Plainfield, IL 60544
Carillon NeighborhoodEstimated Value: $268,492 - $347,000
--
Bed
--
Bath
--
Sq Ft
2,178
Sq Ft Lot
About This Home
This home is located at 20823 W Torrey Pines Ln, Plainfield, IL 60544 and is currently estimated at $299,873. 20823 W Torrey Pines Ln is a home located in Will County with nearby schools including Skoff Elementary School, A. Vito Martinez Middle School, and Romeoville High School.
Ownership History
Date
Name
Owned For
Owner Type
Purchase Details
Closed on
Jan 10, 2018
Sold by
Montez Raymond J
Bought by
Lynray Llc Series 20823
Current Estimated Value
Purchase Details
Closed on
Oct 23, 2012
Sold by
American Midwest Bank
Bought by
Montez Raymond J
Home Financials for this Owner
Home Financials are based on the most recent Mortgage that was taken out on this home.
Original Mortgage
$100,000
Interest Rate
3.28%
Mortgage Type
Purchase Money Mortgage
Purchase Details
Closed on
Nov 1, 1997
Sold by
Burckhardt Stanley and Burckhardt Genevieve
Bought by
First Bank Of Schaumburg and Trust #97-1332
Purchase Details
Closed on
Aug 12, 1997
Sold by
The Northern Trust Company
Bought by
Burckhardt Stanley and Burckhardt Genevieve
Home Financials for this Owner
Home Financials are based on the most recent Mortgage that was taken out on this home.
Original Mortgage
$83,990
Interest Rate
8.5%
Create a Home Valuation Report for This Property
The Home Valuation Report is an in-depth analysis detailing your home's value as well as a comparison with similar homes in the area
Home Values in the Area
Average Home Value in this Area
Purchase History
| Date | Buyer | Sale Price | Title Company |
|---|---|---|---|
| Lynray Llc Series 20823 | -- | Attorney | |
| Montez Raymond J | $100,000 | First American Title | |
| First Bank Of Schaumburg | -- | -- | |
| Burckhardt Stanley | $107,500 | Chicago Title Insurance Co |
Source: Public Records
Mortgage History
| Date | Status | Borrower | Loan Amount |
|---|---|---|---|
| Previous Owner | Montez Raymond J | $100,000 | |
| Previous Owner | Burckhardt Stanley | $83,990 |
Source: Public Records
Tax History Compared to Growth
Tax History
| Year | Tax Paid | Tax Assessment Tax Assessment Total Assessment is a certain percentage of the fair market value that is determined by local assessors to be the total taxable value of land and additions on the property. | Land | Improvement |
|---|---|---|---|---|
| 2024 | $6,523 | $70,357 | $22,888 | $47,469 |
| 2023 | $6,523 | $63,163 | $20,548 | $42,615 |
| 2022 | $5,911 | $59,503 | $19,358 | $40,145 |
| 2021 | $5,665 | $55,919 | $18,192 | $37,727 |
| 2020 | $5,530 | $54,080 | $17,594 | $36,486 |
| 2019 | $5,265 | $51,261 | $16,677 | $34,584 |
| 2018 | $4,507 | $49,274 | $16,030 | $33,244 |
| 2017 | $4,230 | $46,516 | $15,133 | $31,383 |
| 2016 | $3,985 | $43,595 | $14,183 | $29,412 |
| 2015 | $3,478 | $39,504 | $12,852 | $26,652 |
| 2014 | $3,478 | $37,268 | $12,125 | $25,143 |
| 2013 | $3,478 | $34,268 | $12,125 | $22,143 |
Source: Public Records
Map
Nearby Homes
- 20862 W Torrey Pines Ln Unit 1B
- 21019 W Torrey Pines Ct
- 21144 Buckeye Ct
- 13404 Tall Pines Ln
- 21069 W Hazelnut Ln
- 13434 Redberry Cir
- 13810 S Magnolia Dr
- 20928 W Spruce Ln
- 20827 W Honeysuckle Ct
- 13705 S Redbud Dr
- 1228 Le Moyne Ave
- 20965 W Snowberry Ln
- 21220 Silktree Cir
- 21056 W Aspen Ln
- 13232 S Bayberry Ln
- 20944 W Blossom Ln
- 505 N Frieh Dr
- 20842 W Aspen Ct Unit 1
- 13825 S Bristlecone Ln Unit C
- 21327 W Redwood Dr
- 20827 W Torrey Pines
- 20819 W Torrey Pines Ln
- 20815 W Torrey Pines Ln
- 20851 W Torrey Pines Ln
- 20757 W Torrey Pines Ln
- 20855 W Torrey Pines Ln
- 20834 W Torrey Pines Ln
- 20755 W Torrey Pines Ln
- 20826 W Torrey Pines Ln
- 20814 W Torrey Pines
- 20822 W Torrey Pines Ln
- 20838 W Torrey Pines Ln
- 20810 W Torrey Pines Ln
- 20753 W Torrey Pines Ln
- 20818 W Torrey Pines Ln
- 20854 W Torrey Pines Ln
- 13513 S Magnolia Dr
- 20808 W Torrey Pines Ln
- 13511 S Magnolia Dr