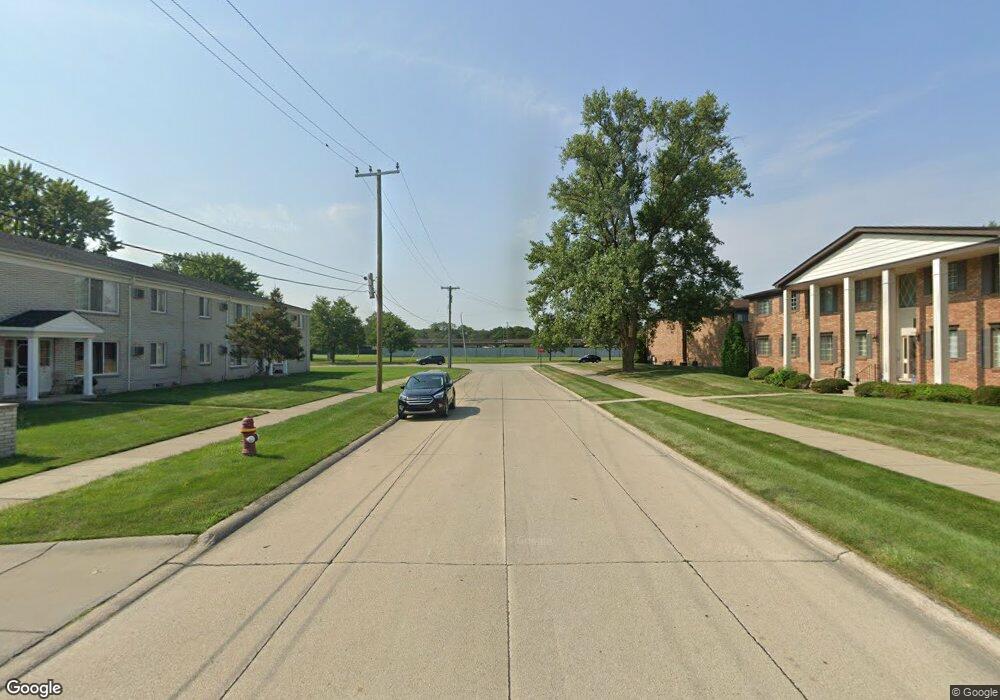
20827 Eastlawn St Unit 62 Saint Clair Shores, MI 48080
Estimated Value: $77,000 - $89,000
2
Beds
2
Baths
950
Sq Ft
$87/Sq Ft
Est. Value
About This Home
This home is located at 20827 Eastlawn St Unit 62, Saint Clair Shores, MI 48080 and is currently estimated at $82,421, approximately $86 per square foot. 20827 Eastlawn St Unit 62 is a home located in Macomb County with nearby schools including South Lake Middle School, South Lake High School, and Chandler Park Academy - Elementary School.
Ownership History
Date
Name
Owned For
Owner Type
Purchase Details
Closed on
Jun 19, 2015
Sold by
Yerby Denise A and Yerby Henry W D
Bought by
Johnson Jones Ginger
Current Estimated Value
Purchase Details
Closed on
Dec 4, 2014
Sold by
Yerby Denise A
Bought by
Yerby Denise A and Yerby Henry W D
Purchase Details
Closed on
Jul 25, 2008
Sold by
Detroit Property Improvement & Investmen
Bought by
Yerby Denise A
Purchase Details
Closed on
Jul 20, 2007
Sold by
Countrywide Home Loans Inc
Bought by
Federal National Mortgage Association
Purchase Details
Closed on
Jun 15, 2007
Sold by
Monzo Aaron K
Bought by
Countrywide Home Loans Inc
Purchase Details
Closed on
Apr 29, 2003
Sold by
Johnston Elaine C
Bought by
Monzo Aaron K
Purchase Details
Closed on
Dec 22, 1994
Sold by
Wojcik Judith Ann
Bought by
Johnston Elaine C
Create a Home Valuation Report for This Property
The Home Valuation Report is an in-depth analysis detailing your home's value as well as a comparison with similar homes in the area
Home Values in the Area
Average Home Value in this Area
Purchase History
| Date | Buyer | Sale Price | Title Company |
|---|---|---|---|
| Johnson Jones Ginger | $25,000 | None Available | |
| Yerby Denise A | -- | None Available | |
| Yerby Denise A | $16,000 | Etitle Agency Inc | |
| Detroit Property Improvement & Investmen | $16,000 | Warranty Title Agency Llc | |
| Federal National Mortgage Association | -- | None Available | |
| Countrywide Home Loans Inc | $62,822 | None Available | |
| Monzo Aaron K | $63,917 | -- | |
| Johnston Elaine C | $42,000 | Philip F Greco Title Company |
Source: Public Records
Tax History Compared to Growth
Tax History
| Year | Tax Paid | Tax Assessment Tax Assessment Total Assessment is a certain percentage of the fair market value that is determined by local assessors to be the total taxable value of land and additions on the property. | Land | Improvement |
|---|---|---|---|---|
| 2025 | $755 | $38,500 | $0 | $0 |
| 2024 | $755 | $33,200 | $0 | $0 |
| 2023 | $928 | $32,600 | $0 | $0 |
| 2022 | $881 | $29,300 | $0 | $0 |
| 2021 | $867 | $26,800 | $0 | $0 |
| 2020 | $867 | $24,000 | $0 | $0 |
| 2019 | $832 | $21,000 | $0 | $0 |
| 2018 | $0 | $15,000 | $0 | $0 |
| 2017 | $792 | $11,900 | $1,500 | $10,400 |
| 2016 | $948 | $11,900 | $0 | $0 |
| 2015 | $621 | $10,600 | $0 | $0 |
| 2013 | -- | $9,800 | $0 | $0 |
| 2012 | -- | $12,600 | $1,500 | $11,100 |
Source: Public Records
Map
Nearby Homes
- 19809 Ridgemont St Unit 45
- 19520 Ridgemont St Unit 16
- 20006 Salisbury St
- 20120 Salisbury St
- 20025 Chalon St
- 20520 Anita St
- 20537 Williamsburg Ct
- 19136 Mott Ave
- 20629 Hollywood St
- 20207 Chalon St
- 20490 van Antwerp St Unit 24
- 20428 Lennon St
- 20456 Lennon St
- Manchester Plan at Fraser Sqaure
- Davenport Plan at Fraser Sqaure
- 20400 Edmunton St
- 20418 Edmunton St
- 20406 Mauer St
- 21780 Eastland Ct
- 20847 Hollywood St
- 20831 Eastlawn St
- 20829 Eastlawn St
- 20823 Eastlawn St Unit 60
- 20821 Eastlawn St Unit 59
- 20819 Eastlawn St
- 20817 Eastlawn St Unit 57
- 20815 Eastlawn St
- 20813 Eastlawn St
- 20811 Eastlawn St Unit 54
- 20809 Eastlawn St
- 20807 Eastlawn St
- 20805 Eastlawn St Unit 51
- 20803 Eastlawn St Unit 50
- 20801 Eastlawn St Unit 49
- 20829 Eastlawn St Unit 63
- 20821 Eastlawn #59 Unit 59
- 19815 Ridgemont St
- 19809 Ridgemont St
- 19807 Ridgemont St Unit 44
- 19805 Ridgemont St