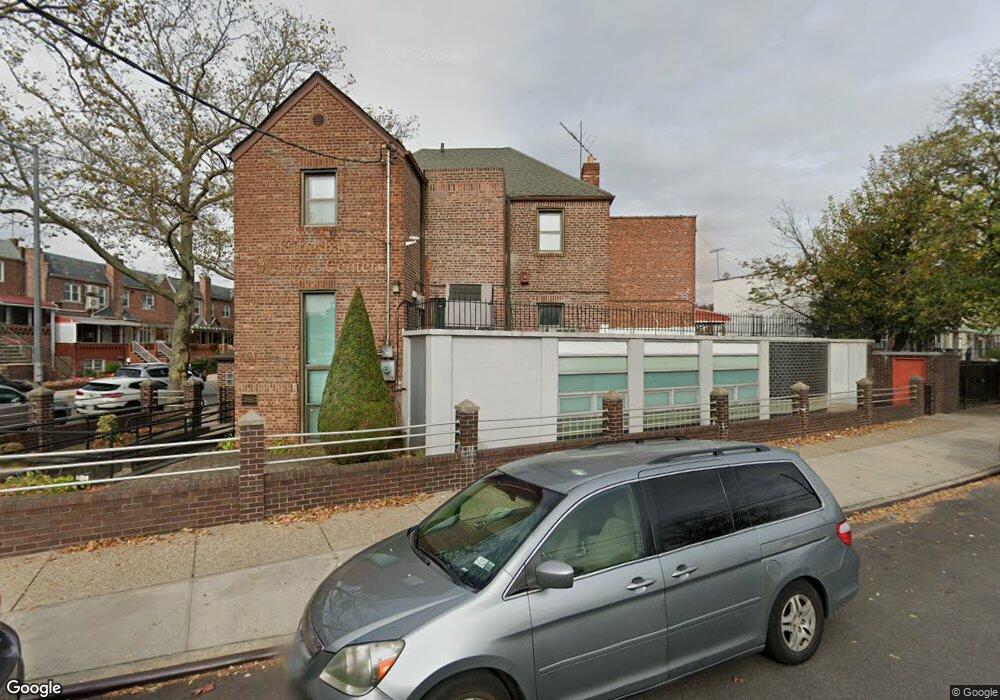
2083 Bragg St Brooklyn, NY 11229
Madison NeighborhoodEstimated Value: $801,000 - $936,000
5
Beds
3
Baths
1,782
Sq Ft
$486/Sq Ft
Est. Value
About This Home
This home is located at 2083 Bragg St, Brooklyn, NY 11229 and is currently estimated at $866,860, approximately $486 per square foot. 2083 Bragg St is a home located in Kings County with nearby schools including P.S. 194 Raoul Wallenberg, J.H.S. 278 Marine Park, and New Visions Charter High School for Advanced Math/ Science.
Ownership History
Date
Name
Owned For
Owner Type
Purchase Details
Closed on
Sep 25, 2024
Sold by
Hu Rui Quan and Hu Sally
Bought by
Hu Sally and Hu Stephanie
Current Estimated Value
Purchase Details
Closed on
Feb 8, 2022
Sold by
Chan Sin Ieng and Chen Hu Yan
Bought by
Chen Hu Yan Ling and Hu Rui Quan
Home Financials for this Owner
Home Financials are based on the most recent Mortgage that was taken out on this home.
Original Mortgage
$392,000
Outstanding Balance
$364,277
Interest Rate
3.92%
Mortgage Type
Purchase Money Mortgage
Estimated Equity
$502,583
Purchase Details
Closed on
Jun 26, 2000
Sold by
Mittal Brij K
Bought by
Kaur Narinder
Home Financials for this Owner
Home Financials are based on the most recent Mortgage that was taken out on this home.
Original Mortgage
$136,500
Interest Rate
9%
Create a Home Valuation Report for This Property
The Home Valuation Report is an in-depth analysis detailing your home's value as well as a comparison with similar homes in the area
Home Values in the Area
Average Home Value in this Area
Purchase History
| Date | Buyer | Sale Price | Title Company |
|---|---|---|---|
| Hu Sally | -- | -- | |
| Hu Sally | -- | -- | |
| Chen Hu Yan Ling | $490,000 | -- | |
| Chen Hu Yan Ling | $490,000 | -- | |
| Chen Hu Yan Ling | $490,000 | -- | |
| Kaur Narinder | $182,000 | Chicago Title Insurance Co | |
| Kaur Narinder | $182,000 | Chicago Title Insurance Co |
Source: Public Records
Mortgage History
| Date | Status | Borrower | Loan Amount |
|---|---|---|---|
| Open | Chen Hu Yan Ling | $392,000 | |
| Closed | Chen Hu Yan Ling | $392,000 | |
| Previous Owner | Kaur Narinder | $136,500 |
Source: Public Records
Tax History
| Year | Tax Paid | Tax Assessment Tax Assessment Total Assessment is a certain percentage of the fair market value that is determined by local assessors to be the total taxable value of land and additions on the property. | Land | Improvement |
|---|---|---|---|---|
| 2025 | $6,438 | $52,500 | $7,320 | $45,180 |
| 2024 | $6,438 | $45,180 | $7,320 | $37,860 |
| 2023 | $6,461 | $49,440 | $7,320 | $42,120 |
| 2022 | $5,991 | $45,480 | $7,320 | $38,160 |
| 2021 | $5,663 | $42,060 | $7,320 | $34,740 |
| 2019 | $5,295 | $39,240 | $7,320 | $31,920 |
| 2018 | $5,106 | $26,510 | $5,796 | $20,714 |
| 2017 | $4,799 | $25,010 | $5,252 | $19,758 |
| 2016 | $4,407 | $23,595 | $5,746 | $17,849 |
| 2015 | $3,120 | $22,260 | $8,160 | $14,100 |
| 2014 | $3,120 | $22,260 | $8,160 | $14,100 |
Source: Public Records
Map
Nearby Homes
- 2156 Gerritsen Ave
- 2126 Gerritsen Ave Unit 101
- 2126 Gerritsen Ave Unit 301
- 2165 Brigham St Unit 3F
- 2165 Brigham St Unit 2A
- 2165 Brigham St Unit 1C
- 2165 Brigham St Unit 6C
- 2170 Brigham St Unit 1D
- 2140 Knapp St Unit 4C
- 2140 Knapp St Unit 1G
- 2140 Knapp St Unit 5H
- 2140 Knapp St Unit 4D
- 2140 Knapp St Unit 3E
- 2190 Brigham St Unit 1B
- 2190 Brigham St Unit 5H
- 2190 Brigham St Unit 4B
- 2190 Brigham St Unit 6G
- 2190 Brigham St Unit 1D
- 3105 Avenue V Unit 6A
- 3105 Avenue V Unit 2E
Your Personal Tour Guide
Ask me questions while you tour the home.