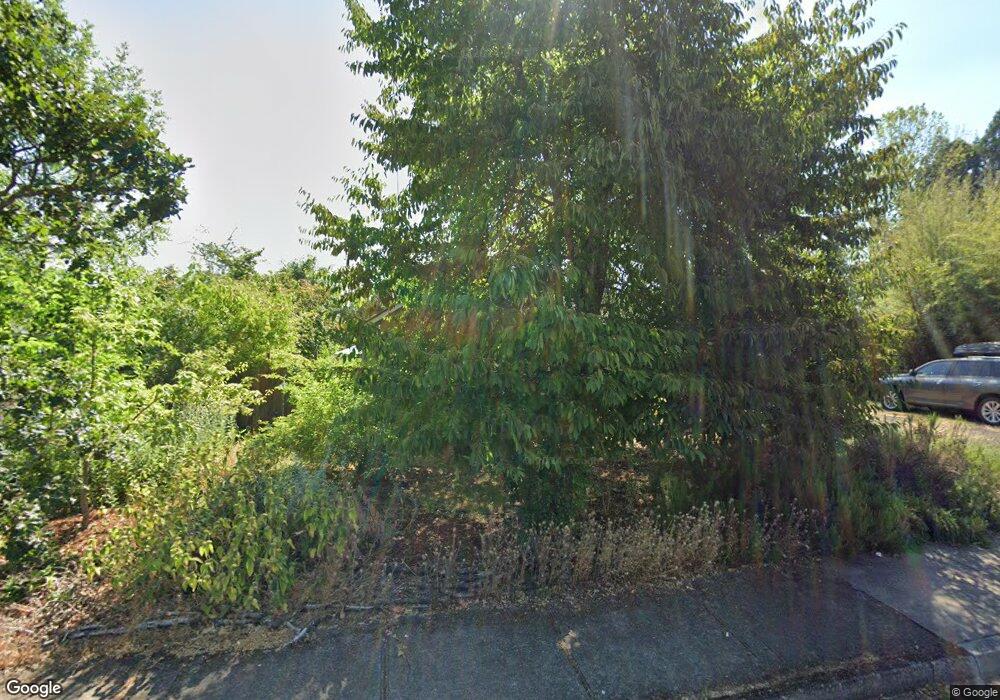
2083 Garfield St Eugene, OR 97405
Far West NeighborhoodEstimated Value: $341,000 - $420,000
3
Beds
1
Bath
974
Sq Ft
$380/Sq Ft
Est. Value
About This Home
This home is located at 2083 Garfield St, Eugene, OR 97405 and is currently estimated at $370,517, approximately $380 per square foot. 2083 Garfield St is a home located in Lane County with nearby schools including Cesar Chavez Elementary School, Arts And Technology Academy At Jefferson, and Churchill High School.
Ownership History
Date
Name
Owned For
Owner Type
Purchase Details
Closed on
Oct 15, 2015
Sold by
Jensen Anne
Bought by
Schock Tobias and Stillwell Kelly
Current Estimated Value
Home Financials for this Owner
Home Financials are based on the most recent Mortgage that was taken out on this home.
Original Mortgage
$175,000
Outstanding Balance
$137,216
Interest Rate
3.86%
Mortgage Type
New Conventional
Estimated Equity
$233,301
Purchase Details
Closed on
Jan 30, 2008
Sold by
Jensen Anne
Bought by
Jensen Anne and Anne Jensen Family Trust
Purchase Details
Closed on
Feb 27, 2007
Sold by
Smith Eric and Smith Orlando
Bought by
Jensen Anne
Home Financials for this Owner
Home Financials are based on the most recent Mortgage that was taken out on this home.
Original Mortgage
$171,200
Interest Rate
6.21%
Mortgage Type
Purchase Money Mortgage
Purchase Details
Closed on
Jul 17, 2006
Sold by
Weathers Morris E and Weathers Lois J
Bought by
Smith Janice and Smith Orlando
Create a Home Valuation Report for This Property
The Home Valuation Report is an in-depth analysis detailing your home's value as well as a comparison with similar homes in the area
Home Values in the Area
Average Home Value in this Area
Purchase History
| Date | Buyer | Sale Price | Title Company |
|---|---|---|---|
| Schock Tobias | $200,000 | Fidelity Natl Title Co Of Or | |
| Jensen Anne | -- | None Available | |
| Jensen Anne | $214,000 | Cascade Title Co | |
| Smith Janice | $125,000 | Fidelity National Title Insu |
Source: Public Records
Mortgage History
| Date | Status | Borrower | Loan Amount |
|---|---|---|---|
| Open | Schock Tobias | $175,000 | |
| Previous Owner | Jensen Anne | $171,200 |
Source: Public Records
Tax History
| Year | Tax Paid | Tax Assessment Tax Assessment Total Assessment is a certain percentage of the fair market value that is determined by local assessors to be the total taxable value of land and additions on the property. | Land | Improvement |
|---|---|---|---|---|
| 2025 | $3,371 | $173,035 | -- | -- |
| 2024 | $3,329 | $167,996 | -- | -- |
| 2023 | $3,329 | $163,103 | $0 | $0 |
| 2022 | $3,119 | $158,353 | $0 | $0 |
| 2021 | $2,930 | $153,741 | $0 | $0 |
| 2020 | $2,940 | $149,264 | $0 | $0 |
| 2019 | $2,839 | $144,917 | $0 | $0 |
| 2018 | $2,673 | $136,599 | $0 | $0 |
| 2017 | $2,553 | $136,599 | $0 | $0 |
| 2016 | $2,464 | $132,620 | $0 | $0 |
| 2015 | $2,391 | $128,757 | $0 | $0 |
| 2014 | $2,351 | $125,007 | $0 | $0 |
Source: Public Records
Map
Nearby Homes
- 2115 Arthur St
- 2064 Grant St
- 2230 Cleveland St
- 2279 City View St
- 2260 Orr Ln
- 1910 W 17th Ave
- 2064 W 17th Ave
- 1735 Cleveland Place
- 1943 W 17th Ave Unit A
- 2070 W 16th Way
- 1674 Hayes St Unit B
- 1935 W 17th Ave Unit B
- 1579 Garfield Place Unit 1579
- 2240 W 25th Place
- 2161 W 16th Ave
- 1890 Taylor St
- 2037 Morning View Dr
- 2132 W 14th Ct
- 2430 Wilson Dr
- 2255 Polk St
- 2105 Garfield St
- 2075 Garfield St
- 2111 Garfield St
- 2045 Garfield St
- 2060 Hayes St
- 2050 Hayes St
- 2120 Hayes St
- 2040 Hayes St
- 2115 Garfield St
- 2035 Garfield St
- 2084 Garfield St
- 2130 Hayes St
- 2060 Garfield St
- 2128 Garfield St
- 2030 Hayes St
- 2050 Garfield St
- 2140 Hayes St
- 2025 Garfield St
- 2145 Garfield St
- 2040 Garfield St
Your Personal Tour Guide
Ask me questions while you tour the home.