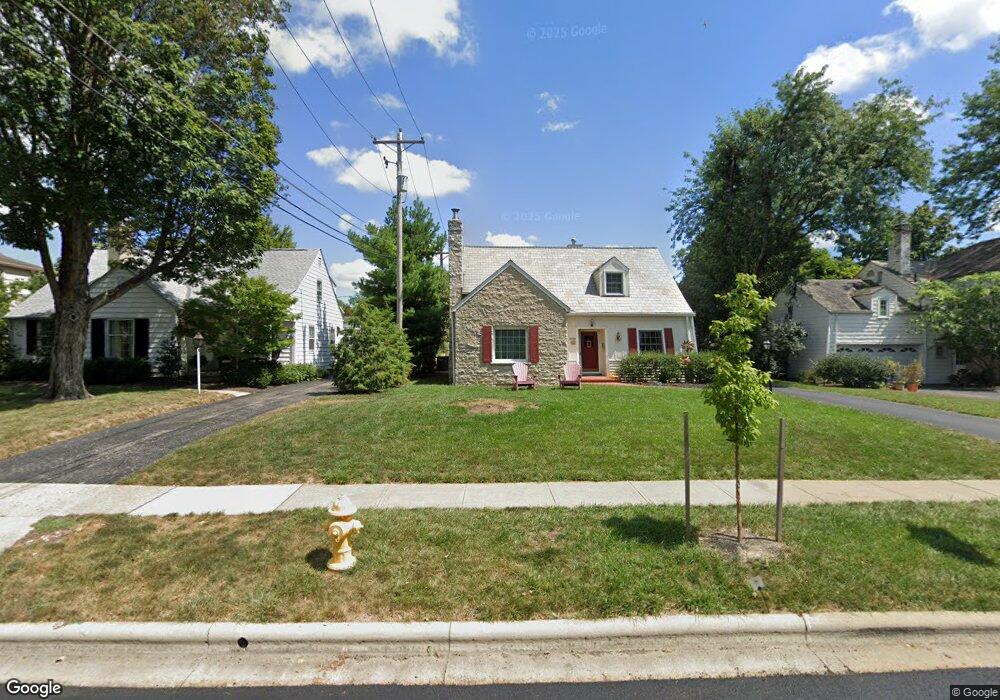
2084 Andover Rd Columbus, OH 43221
Estimated Value: $685,000 - $1,036,000
3
Beds
2
Baths
2,161
Sq Ft
$390/Sq Ft
Est. Value
About This Home
This home is located at 2084 Andover Rd, Columbus, OH 43221 and is currently estimated at $842,519, approximately $389 per square foot. 2084 Andover Rd is a home located in Franklin County with nearby schools including Barrington Road Elementary School, Jones Middle School, and Upper Arlington High School.
Ownership History
Date
Name
Owned For
Owner Type
Purchase Details
Closed on
Jul 31, 2003
Sold by
Braig Kevin P and Braig Kristen T
Bought by
Benton John C and Benton Katharine P
Current Estimated Value
Home Financials for this Owner
Home Financials are based on the most recent Mortgage that was taken out on this home.
Original Mortgage
$215,000
Outstanding Balance
$92,468
Interest Rate
5.3%
Mortgage Type
Purchase Money Mortgage
Estimated Equity
$750,051
Purchase Details
Closed on
May 17, 2000
Sold by
Pickens Paige L
Bought by
Braig Kevin P and Braig Kristen T
Home Financials for this Owner
Home Financials are based on the most recent Mortgage that was taken out on this home.
Original Mortgage
$245,000
Interest Rate
8.12%
Purchase Details
Closed on
Sep 10, 1997
Sold by
Kindler Jack W and Kindler Elyse S
Bought by
Pickens Paige L
Purchase Details
Closed on
May 1, 1986
Purchase Details
Closed on
Jun 1, 1984
Create a Home Valuation Report for This Property
The Home Valuation Report is an in-depth analysis detailing your home's value as well as a comparison with similar homes in the area
Home Values in the Area
Average Home Value in this Area
Purchase History
| Date | Buyer | Sale Price | Title Company |
|---|---|---|---|
| Benton John C | $275,000 | Assurance Title Agency Of Oh | |
| Braig Kevin P | $245,000 | Chicago Title | |
| Pickens Paige L | $207,500 | Chicago Title | |
| -- | $108,000 | -- | |
| -- | $100,000 | -- |
Source: Public Records
Mortgage History
| Date | Status | Borrower | Loan Amount |
|---|---|---|---|
| Open | Benton John C | $215,000 | |
| Closed | Braig Kevin P | $245,000 |
Source: Public Records
Tax History Compared to Growth
Tax History
| Year | Tax Paid | Tax Assessment Tax Assessment Total Assessment is a certain percentage of the fair market value that is determined by local assessors to be the total taxable value of land and additions on the property. | Land | Improvement |
|---|---|---|---|---|
| 2024 | $14,443 | $249,480 | $122,640 | $126,840 |
| 2023 | $14,264 | $249,480 | $122,640 | $126,840 |
| 2022 | $13,026 | $186,410 | $70,980 | $115,430 |
| 2021 | $11,531 | $186,410 | $70,980 | $115,430 |
| 2020 | $11,429 | $186,410 | $70,980 | $115,430 |
| 2019 | $11,546 | $166,500 | $70,980 | $95,520 |
| 2018 | $10,649 | $166,500 | $70,980 | $95,520 |
| 2017 | $10,641 | $166,500 | $70,980 | $95,520 |
| 2016 | $9,826 | $148,610 | $55,090 | $93,520 |
| 2015 | $9,817 | $148,610 | $55,090 | $93,520 |
| 2014 | $9,828 | $148,610 | $55,090 | $93,520 |
| 2013 | $4,694 | $135,100 | $50,085 | $85,015 |
Source: Public Records
Map
Nearby Homes
- 2110 Northwest Blvd
- 1914 Elmwood Ave
- 1869 Tewksbury Rd
- 1535 Doone Rd
- 1782 Wyandotte Rd
- 1565 Berkshire Rd
- 1733 Elmwood Ave
- 2063 Westover Rd
- 1398 Lower Green Cir Unit 1398
- 1661 Ashland Ave Unit 663
- 1561 Glenn Ave
- 2015 W 5th Ave Unit 211
- 2015 W 5th Ave Unit 102
- 2015 W 5th Ave Unit 108
- 1631 Roxbury Rd Unit F3
- 1631 Roxbury Rd Unit B6
- 2583 Wexford Rd
- 1364 W 7th Ave
- 1459 Elmwood Ave Unit 1459
- 00 W 7th Ave
- 2092 Andover Rd
- 2074 Andover Rd
- 1783 Barrington Rd
- 1795 Barrington Rd
- 1780 Waltham Rd
- 1768 Waltham Rd
- 1775 Barrington Rd
- 1810 Waltham Rd
- 1760 Waltham Rd
- 1767 Barrington Rd
- 1823 Barrington Rd
- 1754 Waltham Rd
- 1751 Barrington Rd
- 1801 Waltham Rd
- 1775 Waltham Rd
- 1746 Waltham Rd
- 1830 Waltham Rd
- 1811 Waltham Rd
- 1833 Barrington Rd
- 2057 Wyandotte Rd