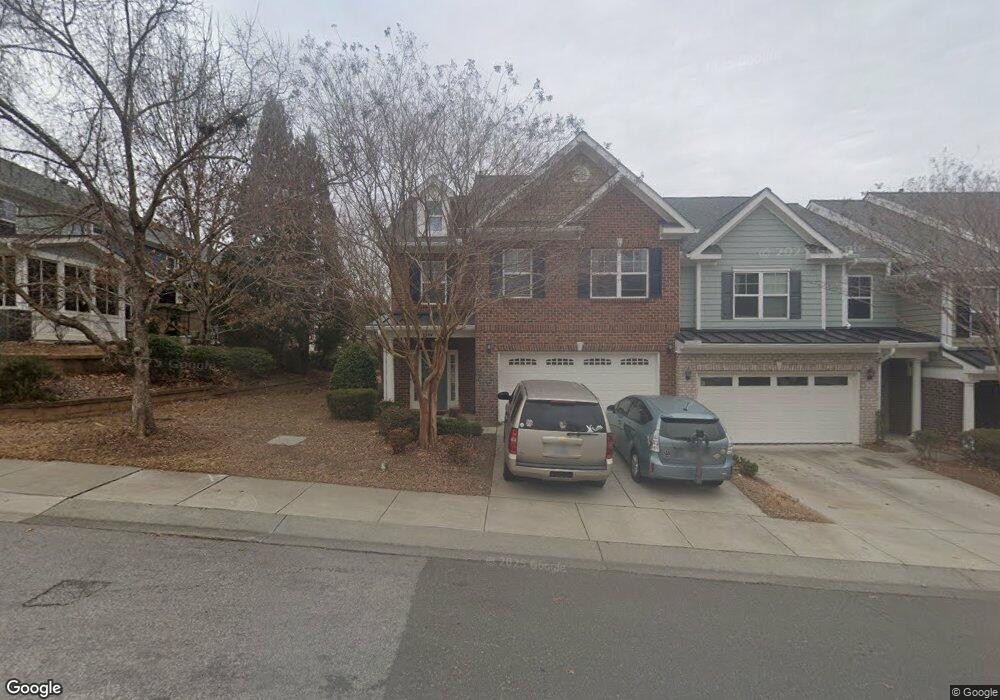
2084 Weston Green Loop Cary, NC 27513
Weston NeighborhoodEstimated Value: $488,470 - $526,000
3
Beds
3
Baths
1,955
Sq Ft
$257/Sq Ft
Est. Value
About This Home
This home is located at 2084 Weston Green Loop, Cary, NC 27513 and is currently estimated at $503,118, approximately $257 per square foot. 2084 Weston Green Loop is a home located in Wake County with nearby schools including Northwoods Elementary School, West Cary Middle School, and Cary High School.
Ownership History
Date
Name
Owned For
Owner Type
Purchase Details
Closed on
Jan 22, 2014
Sold by
Brunner David and Brunner Shelby
Bought by
Paterson Sharon D and Paterson David
Current Estimated Value
Home Financials for this Owner
Home Financials are based on the most recent Mortgage that was taken out on this home.
Original Mortgage
$227,106
Outstanding Balance
$171,781
Interest Rate
4.44%
Mortgage Type
FHA
Estimated Equity
$331,337
Purchase Details
Closed on
May 13, 2010
Sold by
Foreverhome Llc
Bought by
Brunner David
Home Financials for this Owner
Home Financials are based on the most recent Mortgage that was taken out on this home.
Original Mortgage
$228,563
Interest Rate
5.06%
Mortgage Type
FHA
Purchase Details
Closed on
Feb 9, 2010
Sold by
Weston Place Llc
Bought by
Foreverhome Llc
Purchase Details
Closed on
Jun 15, 2009
Sold by
Mcol Development Three Lp
Bought by
Weston Place Llc
Create a Home Valuation Report for This Property
The Home Valuation Report is an in-depth analysis detailing your home's value as well as a comparison with similar homes in the area
Home Values in the Area
Average Home Value in this Area
Purchase History
| Date | Buyer | Sale Price | Title Company |
|---|---|---|---|
| Paterson Sharon D | $248,000 | None Available | |
| Brunner David | $233,000 | None Available | |
| Foreverhome Llc | $200,000 | None Available | |
| Weston Place Llc | $2,100,000 | None Available |
Source: Public Records
Mortgage History
| Date | Status | Borrower | Loan Amount |
|---|---|---|---|
| Open | Paterson Sharon D | $227,106 | |
| Previous Owner | Brunner David | $228,563 |
Source: Public Records
Tax History Compared to Growth
Tax History
| Year | Tax Paid | Tax Assessment Tax Assessment Total Assessment is a certain percentage of the fair market value that is determined by local assessors to be the total taxable value of land and additions on the property. | Land | Improvement |
|---|---|---|---|---|
| 2025 | $4,167 | $483,885 | $95,000 | $388,885 |
| 2024 | $4,077 | $483,885 | $95,000 | $388,885 |
| 2023 | $3,248 | $322,112 | $60,000 | $262,112 |
| 2022 | $3,127 | $322,112 | $60,000 | $262,112 |
| 2021 | $3,064 | $322,112 | $60,000 | $262,112 |
| 2020 | $3,080 | $322,112 | $60,000 | $262,112 |
| 2019 | $2,930 | $271,746 | $70,000 | $201,746 |
| 2018 | $2,749 | $271,746 | $70,000 | $201,746 |
| 2017 | $2,642 | $271,746 | $70,000 | $201,746 |
| 2016 | $2,603 | $271,746 | $70,000 | $201,746 |
| 2015 | $2,435 | $245,257 | $62,000 | $183,257 |
| 2014 | $2,296 | $245,257 | $62,000 | $183,257 |
Source: Public Records
Map
Nearby Homes
- 2063 Weston Green Loop
- 302 Peachtree Point Ct
- 210 Rosenberry Hills Dr
- 1624 Wilson Rd
- 102 Rose Valley Woods Dr
- 1113 Flip Trail
- 303 View Dr
- 137 Cricketgrass Dr
- 304 Silvergrove Dr
- 1133 Evans Rd
- 314 Montelena Place
- 102 Anna Lake Ln
- 115 Abingdon Ct Unit 2b
- 104 Bailey Park Ct
- 605 Birchwood Crest Trail
- 103 Evans Estates Dr
- 784 Ballyneal Aly
- 788 Ballyneal Aly
- 107 Canyon Run
- 768 Ballyneal Aly
- 2080 Weston Green Loop
- 2078 Weston Green Loop
- 100 Langford Valley Way
- 102 Langford Valley Way
- 104 Langford Valley Way
- 106 Langford Valley Way
- 106 Langford Valley Way Unit 153
- 2083 Weston Green Loop
- 2083 Weston Green Loop Unit 25
- 3001 Weston Green Loop
- 2081 Weston Green Loop
- 2081 Weston Green Loop Unit 26
- 3005 Weston Green Loop
- 110 Langford Valley Way
- 2079 Weston Green Loop
- 2077 Weston Green Loop
- 2062 Weston Green Loop
- 112 Langford Valley Way
- 114 Langford Valley Way
- 3007 Weston Green Loop