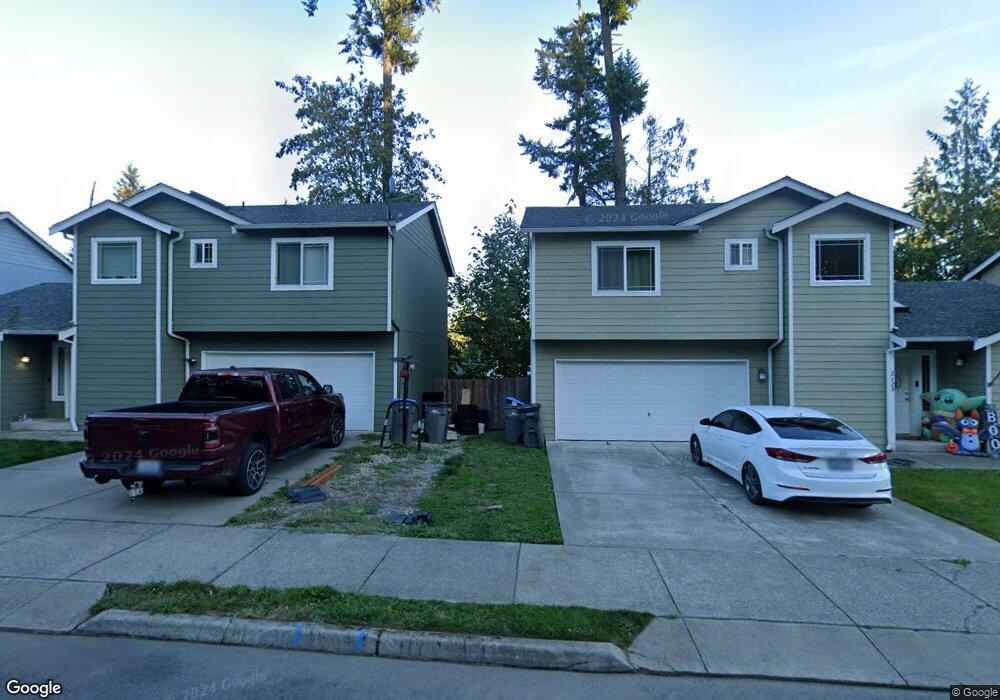
2085 Caleb Place SE Port Orchard, WA 98366
Estimated Value: $460,000 - $494,000
3
Beds
3
Baths
1,494
Sq Ft
$316/Sq Ft
Est. Value
About This Home
This home is located at 2085 Caleb Place SE, Port Orchard, WA 98366 and is currently estimated at $471,613, approximately $315 per square foot. 2085 Caleb Place SE is a home with nearby schools including Sidney Glen Elementary School, Cedar Heights Middle School, and South Kitsap High School.
Ownership History
Date
Name
Owned For
Owner Type
Purchase Details
Closed on
Apr 1, 2010
Sold by
Sdc Homes Llc
Bought by
Nelson Andrew
Current Estimated Value
Home Financials for this Owner
Home Financials are based on the most recent Mortgage that was taken out on this home.
Original Mortgage
$169,600
Outstanding Balance
$113,015
Interest Rate
5.01%
Mortgage Type
New Conventional
Estimated Equity
$358,598
Purchase Details
Closed on
Oct 28, 2009
Sold by
Fingarson & Associates Llc
Bought by
Sdc Homes Llc
Create a Home Valuation Report for This Property
The Home Valuation Report is an in-depth analysis detailing your home's value as well as a comparison with similar homes in the area
Home Values in the Area
Average Home Value in this Area
Purchase History
| Date | Buyer | Sale Price | Title Company |
|---|---|---|---|
| Nelson Andrew | $213,033 | Lawyers Title Ins Corp | |
| Sdc Homes Llc | $300,280 | Pacific Nw Title |
Source: Public Records
Mortgage History
| Date | Status | Borrower | Loan Amount |
|---|---|---|---|
| Open | Nelson Andrew | $169,600 |
Source: Public Records
Tax History Compared to Growth
Tax History
| Year | Tax Paid | Tax Assessment Tax Assessment Total Assessment is a certain percentage of the fair market value that is determined by local assessors to be the total taxable value of land and additions on the property. | Land | Improvement |
|---|---|---|---|---|
| 2026 | $3,400 | $391,450 | $58,000 | $333,450 |
| 2025 | $3,400 | $389,570 | $56,110 | $333,460 |
| 2024 | $3,282 | $389,570 | $56,110 | $333,460 |
| 2023 | $3,279 | $389,570 | $56,110 | $333,460 |
| 2022 | $3,202 | $320,200 | $52,400 | $267,800 |
| 2021 | $2,797 | $265,120 | $48,690 | $216,430 |
| 2020 | $2,748 | $252,630 | $46,370 | $206,260 |
| 2019 | $2,329 | $234,420 | $45,530 | $188,890 |
| 2018 | $2,436 | $189,280 | $45,530 | $143,750 |
| 2017 | $2,074 | $189,280 | $45,530 | $143,750 |
| 2016 | $2,002 | $169,080 | $45,530 | $123,550 |
| 2015 | $1,928 | $165,520 | $45,530 | $119,990 |
| 2014 | -- | $163,140 | $45,530 | $117,610 |
| 2013 | -- | $175,500 | $47,930 | $127,570 |
Source: Public Records
Map
Nearby Homes
- 1147 SE Salmonberry Rd
- 280 Flower Meadows St
- 171 SW Marcia Way
- 4275 Acacia Ln SE
- 122 Fireweed St
- 4278 Acacia Ln SE
- 3922 Bethel Rd SE
- 4350 Nettle Dr SE
- 4207 Nettle Dr SE
- 1 SE Salmonberry Rd
- 1632 SE Salmonberry Rd
- 4463 Bristol Ln SE
- 1743 SE Crawford Rd
- 1450 Bill Ave
- 4505 Bristol Ln SE
- 155 May St W
- 1401 Sidney Ave
- 1932 SE Salmonberry Rd
- 1164 Koda Cir SE
- 1350 SE Shelton Ln
- 2091 Caleb Place SE
- 2079 Caleb Place SE
- 2073 Caleb Place SE
- 2067 Caleb Place SE
- 2117 Indigo Point Place
- 2125 Indigo Point Place
- 2117 Indigo Pointe Place
- 2109 Indigo Pointe Place
- 2109 Indigo Point Place
- 2125 Indigo Pointe Place
- 2096 Caleb Place SE
- 2145 Caleb Place SE
- 2133 Indigo Point Place
- 2090 Caleb Place SE
- 2157 Caleb Place SE
- 2163 Caleb Place SE
- 2141 Indigo Point Place
- 2168 Caleb Place SE
- 2169 Caleb Place SE
- 2101 Indigo Point Place