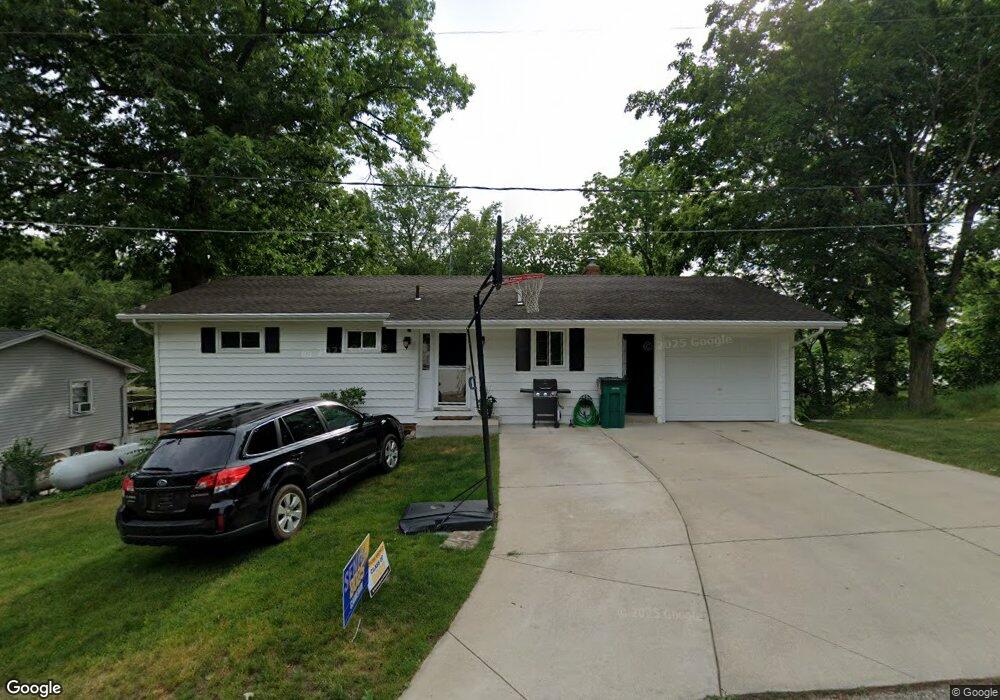
2085 Forrest Dr Allegan, MI 49010
Estimated Value: $387,273 - $458,000
4
Beds
2
Baths
988
Sq Ft
$422/Sq Ft
Est. Value
About This Home
This home is located at 2085 Forrest Dr, Allegan, MI 49010 and is currently estimated at $416,818, approximately $421 per square foot. 2085 Forrest Dr is a home located in Allegan County with nearby schools including North Ward Elementary School, L.E. White Middle School, and Allegan High School.
Ownership History
Date
Name
Owned For
Owner Type
Purchase Details
Closed on
Aug 13, 2020
Sold by
Spray James S and Spray Mary E
Bought by
Hibma Timothy E and Hibma Caroline J
Current Estimated Value
Home Financials for this Owner
Home Financials are based on the most recent Mortgage that was taken out on this home.
Original Mortgage
$185,000
Outstanding Balance
$147,606
Interest Rate
2.9%
Mortgage Type
New Conventional
Estimated Equity
$269,212
Purchase Details
Closed on
Oct 16, 2009
Sold by
Dame Chad J and Dame Janna L
Bought by
Spray James S and Spray Mary E
Purchase Details
Closed on
Nov 18, 1998
Sold by
Griffith Paul H and Griffith Christine
Bought by
Dame Chad J and Dame Janna L
Create a Home Valuation Report for This Property
The Home Valuation Report is an in-depth analysis detailing your home's value as well as a comparison with similar homes in the area
Home Values in the Area
Average Home Value in this Area
Purchase History
| Date | Buyer | Sale Price | Title Company |
|---|---|---|---|
| Hibma Timothy E | $280,000 | None Available | |
| Spray James S | $141,000 | Chicago Title | |
| Dame Chad J | $129,500 | -- |
Source: Public Records
Mortgage History
| Date | Status | Borrower | Loan Amount |
|---|---|---|---|
| Open | Hibma Timothy E | $185,000 |
Source: Public Records
Tax History Compared to Growth
Tax History
| Year | Tax Paid | Tax Assessment Tax Assessment Total Assessment is a certain percentage of the fair market value that is determined by local assessors to be the total taxable value of land and additions on the property. | Land | Improvement |
|---|---|---|---|---|
| 2025 | $4,003 | $182,700 | $49,200 | $133,500 |
| 2024 | $5,515 | $159,300 | $47,100 | $112,200 |
| 2023 | $5,515 | $132,300 | $38,900 | $93,400 |
| 2022 | $5,515 | $107,200 | $32,400 | $74,800 |
| 2021 | $2,766 | $98,900 | $29,400 | $69,500 |
| 2020 | $2,766 | $94,700 | $32,400 | $62,300 |
| 2019 | $0 | $93,500 | $32,800 | $60,700 |
| 2018 | $0 | $95,900 | $33,900 | $62,000 |
| 2017 | $0 | $95,000 | $32,400 | $62,600 |
| 2016 | $0 | $86,700 | $23,600 | $63,100 |
| 2015 | -- | $86,700 | $23,600 | $63,100 |
| 2014 | -- | $71,400 | $25,800 | $45,600 |
| 2013 | -- | $61,900 | $21,000 | $40,900 |
Source: Public Records
Map
Nearby Homes