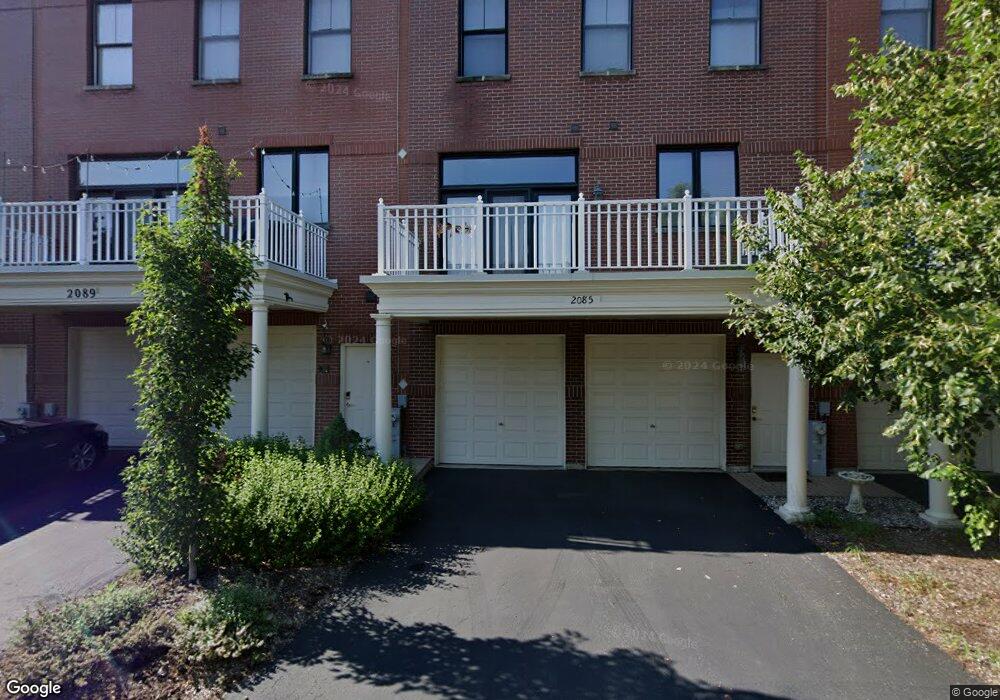
2085 Valor Ct Unit 23 Glenview, IL 60026
The Glen NeighborhoodEstimated Value: $698,083 - $813,000
4
Beds
--
Bath
3,000
Sq Ft
$257/Sq Ft
Est. Value
About This Home
This home is located at 2085 Valor Ct Unit 23, Glenview, IL 60026 and is currently estimated at $771,521, approximately $257 per square foot. 2085 Valor Ct Unit 23 is a home located in Cook County with nearby schools including Westbrook Elementary School, Glen Grove Elementary School, and Attea Middle School.
Ownership History
Date
Name
Owned For
Owner Type
Purchase Details
Closed on
Sep 12, 2013
Sold by
Kim Sung Rim
Bought by
Kim Charles W and Kim Pamela
Current Estimated Value
Purchase Details
Closed on
Jul 25, 2003
Sold by
Kim Chae W
Bought by
Chae Whu Kim Revocable Trust and Sung Rim Kim Revocable Trust
Home Financials for this Owner
Home Financials are based on the most recent Mortgage that was taken out on this home.
Original Mortgage
$433,800
Outstanding Balance
$169,274
Interest Rate
4.62%
Mortgage Type
Purchase Money Mortgage
Estimated Equity
$602,247
Purchase Details
Closed on
Jun 26, 2003
Sold by
The Glen Townhomes Lp
Bought by
Kim Chae W
Home Financials for this Owner
Home Financials are based on the most recent Mortgage that was taken out on this home.
Original Mortgage
$433,800
Outstanding Balance
$169,274
Interest Rate
4.62%
Mortgage Type
Purchase Money Mortgage
Estimated Equity
$602,247
Create a Home Valuation Report for This Property
The Home Valuation Report is an in-depth analysis detailing your home's value as well as a comparison with similar homes in the area
Home Values in the Area
Average Home Value in this Area
Purchase History
| Date | Buyer | Sale Price | Title Company |
|---|---|---|---|
| Kim Charles W | -- | None Available | |
| Kim Sung Rim | -- | None Available | |
| Chae Whu Kim Revocable Trust | -- | -- | |
| Kim Chae W | $614,000 | Stewart Title |
Source: Public Records
Mortgage History
| Date | Status | Borrower | Loan Amount |
|---|---|---|---|
| Open | Kim Chae W | $433,800 |
Source: Public Records
Tax History
| Year | Tax Paid | Tax Assessment Tax Assessment Total Assessment is a certain percentage of the fair market value that is determined by local assessors to be the total taxable value of land and additions on the property. | Land | Improvement |
|---|---|---|---|---|
| 2025 | $13,407 | $69,409 | $9,036 | $60,373 |
| 2024 | $13,407 | $66,540 | $7,658 | $58,882 |
| 2023 | $8,784 | $66,540 | $7,658 | $58,882 |
| 2022 | $8,784 | $66,540 | $7,658 | $58,882 |
| 2021 | $9,897 | $60,861 | $3,675 | $57,186 |
| 2020 | $13,595 | $60,861 | $3,675 | $57,186 |
| 2019 | $12,665 | $66,891 | $3,675 | $63,216 |
| 2018 | $9,434 | $58,711 | $3,216 | $55,495 |
| 2017 | $9,022 | $58,711 | $3,216 | $55,495 |
| 2016 | $11,514 | $58,711 | $3,216 | $55,495 |
| 2015 | $11,191 | $51,489 | $2,603 | $48,886 |
| 2014 | $11,008 | $51,489 | $2,603 | $48,886 |
| 2013 | $11,014 | $53,104 | $2,603 | $50,501 |
Source: Public Records
Map
Nearby Homes
- 2531 Violet St
- 1813 Admiral Ct Unit 118
- 2464 Violet St
- 2701 Commons Dr Unit 210
- 1619 Patriot Blvd
- 102 Yale Ct Unit 34LH10
- 1615 Greenwood Rd
- 2020 Chestnut Ave Unit 312
- 1340 Huber Ln
- 2710 Langley Cir Unit 201003
- 1605 Elmdale Ave
- 2000 Chestnut Ave Unit 103
- 2000 Chestnut Ave Unit 407
- 3501 Lawson Rd
- 3100 Lexington Ln Unit 312
- 2132 Rugen Rd Unit E
- 2533 Windsor Ln
- 2050 Valencia Dr Unit 300C
- 1855 Tanglewood Dr Unit F
- 3212 Lindenwood Ln
- 2089 Valor Ct Unit 22
- 2077 Valor Ct Unit 25
- 2093 Valor Ct Unit 21
- 2073 Valor Ct Unit 26
- 2069 Valor Ct Unit 27
- 2065 Valor Ct Unit 28
- 2076 Valor Ct Unit 20
- 2072 Valor Ct Unit 19
- 2061 Valor Ct Unit 29
- 2068 Valor Ct Unit 18
- 2064 Valor Ct Unit 17
- 2057 Valor Ct Unit 30
- 2060 Valor Ct Unit 16
- 2053 Valor Ct Unit 31
- 2001 Valor Ct Unit 44
- 2009 Valor Ct Unit 42
- 2049 Valor Ct Unit 32
- 2004 Valor Ct Unit 2
- 2045 Valor Ct Unit 33
- 2000 Valor Ct Unit 1
Your Personal Tour Guide
Ask me questions while you tour the home.