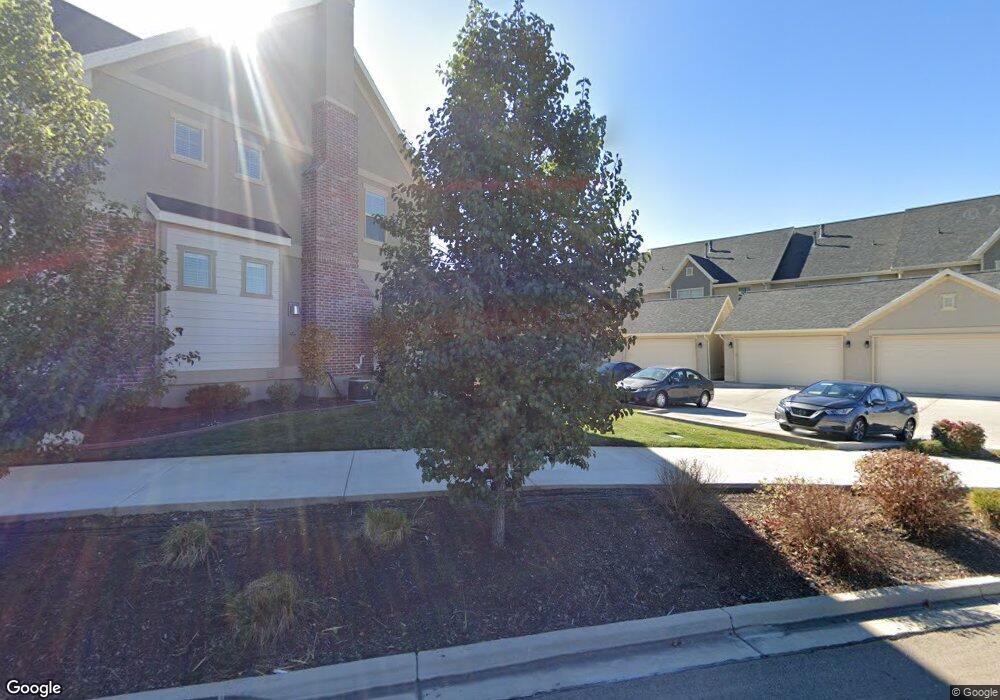
2085 W Crescent Row Mapleton, UT 84664
Estimated Value: $422,000 - $442,394
3
Beds
3
Baths
2,485
Sq Ft
$175/Sq Ft
Est. Value
About This Home
This home is located at 2085 W Crescent Row, Mapleton, UT 84664 and is currently estimated at $434,599, approximately $174 per square foot. 2085 W Crescent Row is a home located in Utah County with nearby schools including Maple Ridge Elementary, Mapleton Junior High School, and Maple Mountain High School.
Ownership History
Date
Name
Owned For
Owner Type
Purchase Details
Closed on
Jan 12, 2024
Sold by
Lloyd O Randall Trust and Mary Girton Randall Trust
Bought by
Flock Carl Brian and Jafarzadeh Massi
Current Estimated Value
Purchase Details
Closed on
Sep 29, 2021
Sold by
Lloyd Randall
Bought by
Mary Griton Randall Trust and Lloyd O Randall Trust
Home Financials for this Owner
Home Financials are based on the most recent Mortgage that was taken out on this home.
Original Mortgage
$209,000
Interest Rate
2.8%
Mortgage Type
New Conventional
Purchase Details
Closed on
Oct 27, 2017
Sold by
Randall Lloyd O and Randall Mary G
Bought by
Randall Lloyd O and The Lloyd O Randall Trust
Purchase Details
Closed on
Oct 25, 2017
Sold by
Deushane Property Management Inc
Bought by
Randall Lloyd O and Randall Mary G
Create a Home Valuation Report for This Property
The Home Valuation Report is an in-depth analysis detailing your home's value as well as a comparison with similar homes in the area
Home Values in the Area
Average Home Value in this Area
Purchase History
| Date | Buyer | Sale Price | Title Company |
|---|---|---|---|
| Flock Carl Brian | -- | Secure Title | |
| Mary Griton Randall Trust | -- | Accommodation/Courtesy Recordi | |
| Randall Lloyd | -- | Steed Title | |
| Randall Lloyd O | -- | Provo Abstract Co Inc | |
| Randall Lloyd O | -- | Provo Abstract Co Inc |
Source: Public Records
Mortgage History
| Date | Status | Borrower | Loan Amount |
|---|---|---|---|
| Previous Owner | Randall Lloyd | $209,000 |
Source: Public Records
Tax History
| Year | Tax Paid | Tax Assessment Tax Assessment Total Assessment is a certain percentage of the fair market value that is determined by local assessors to be the total taxable value of land and additions on the property. | Land | Improvement |
|---|---|---|---|---|
| 2025 | $2,405 | $232,925 | -- | -- |
| 2024 | $2,405 | $235,565 | $0 | $0 |
| 2023 | $2,328 | $229,515 | $0 | $0 |
| 2022 | $2,005 | $195,415 | $0 | $0 |
| 2021 | $1,898 | $284,000 | $42,600 | $241,400 |
| 2020 | $1,962 | $284,000 | $51,100 | $232,900 |
| 2019 | $1,922 | $284,000 | $51,100 | $232,900 |
| 2018 | $1,920 | $270,000 | $41,600 | $228,400 |
| 2017 | $603 | $45,000 | $0 | $0 |
Source: Public Records
Map
Nearby Homes
- 906 S Crescent Way
- 1997 W Crescent Dr
- 161 W 250 S
- 473 W 350 S Unit 31
- 1058 S Lilac Way
- 2216 W Silver Leaf Dr Unit 35
- 1826 W River Birch Rd
- 715 W 4600 S Unit Lot I303
- 715 W 4600 S Unit Lot I304
- 768 N Old Fort Dr
- 812 N Old Fort Dr
- 644 N Old Fort Dr
- 638 N Old Fort Dr
- 674 S Meade St
- 442 S Doubleday St
- 1810 W 300 S Unit D
- 934 N Laredo Dr
- 572 S Chamberlain St
- 2567 E 830 N
- 672 N 2560 E
- 2084 W Crescent Way Unit M-47
- 2083 W Crescent Row
- 2082 W Crescent Way Unit M-11
- 2082 W Crescent Way Unit M-46
- 882 S Crescent Way
- 896 S Crescent Way
- 2078 W Crescent Way Unit M-45
- 2079 W Crescent Row
- 906 S Crescent Way Unit M-5
- 872 S Crescent Way Unit M-1
- 918 S Crescent Way Unit M-7
- 918 S Crescent Way
- 2071 W Crescent Row
- 924 S Crescent Way Unit M-8
- 2067 W Crescent Row
- 2066 W Crescent Row
- 2066 Crescent Row
- 2059 W Crescent Row
- 932 S Crescent Way
- 932 S Crescent Way
Your Personal Tour Guide
Ask me questions while you tour the home.