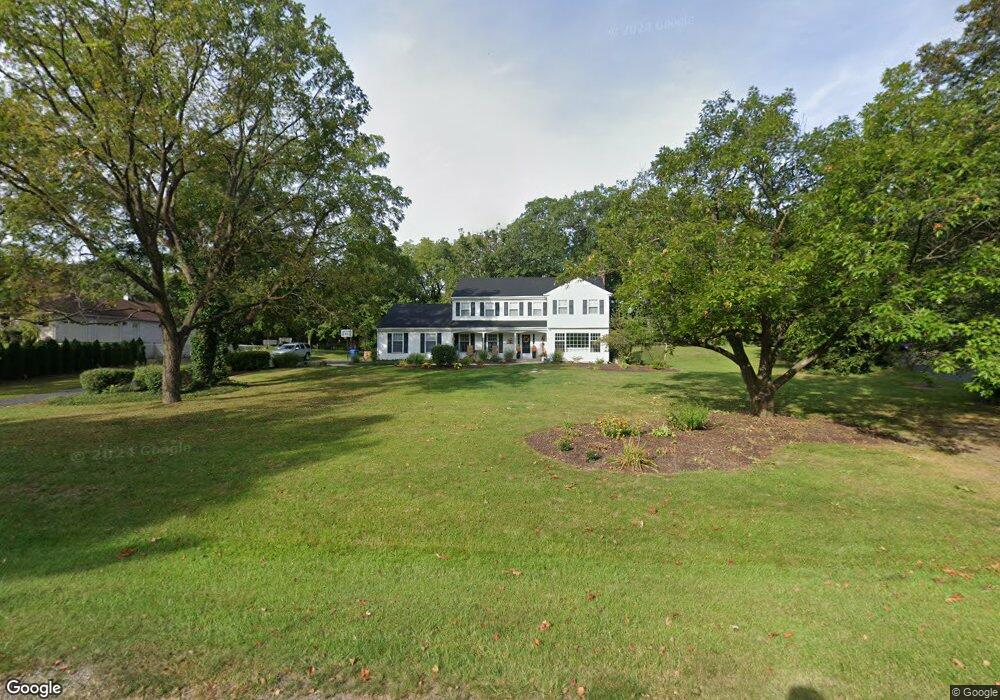
20862 N Buffalo Run Kildeer, IL 60047
Estimated Value: $681,544 - $887,000
--
Bed
3
Baths
2,710
Sq Ft
$296/Sq Ft
Est. Value
About This Home
This home is located at 20862 N Buffalo Run, Kildeer, IL 60047 and is currently estimated at $801,136, approximately $295 per square foot. 20862 N Buffalo Run is a home located in Lake County with nearby schools including Isaac Fox Elementary School, Lake Zurich Middle School - South Campus, and Lake Zurich High School.
Ownership History
Date
Name
Owned For
Owner Type
Purchase Details
Closed on
Jul 18, 2024
Sold by
Pijut Dale A and Pijut Nancy J
Bought by
Magnolia Revocable Living Trust and Pijut
Current Estimated Value
Purchase Details
Closed on
Dec 30, 2014
Sold by
Declarat Savio Virginia B and Declarat Virginia B Savio 2005
Bought by
Pijut Dale and Pijut Nancy
Home Financials for this Owner
Home Financials are based on the most recent Mortgage that was taken out on this home.
Original Mortgage
$398,250
Interest Rate
4.37%
Mortgage Type
New Conventional
Purchase Details
Closed on
Jun 21, 2005
Sold by
Savio Mary B and Savio Virginia B
Bought by
Declarat Savio Virginia B and Declarat Virginia B Savio 2005
Create a Home Valuation Report for This Property
The Home Valuation Report is an in-depth analysis detailing your home's value as well as a comparison with similar homes in the area
Home Values in the Area
Average Home Value in this Area
Purchase History
| Date | Buyer | Sale Price | Title Company |
|---|---|---|---|
| Magnolia Revocable Living Trust | -- | None Listed On Document | |
| Pijut Dale | $442,500 | Fidelity National Title | |
| Declarat Savio Virginia B | -- | -- |
Source: Public Records
Mortgage History
| Date | Status | Borrower | Loan Amount |
|---|---|---|---|
| Previous Owner | Pijut Dale | $398,250 |
Source: Public Records
Tax History Compared to Growth
Tax History
| Year | Tax Paid | Tax Assessment Tax Assessment Total Assessment is a certain percentage of the fair market value that is determined by local assessors to be the total taxable value of land and additions on the property. | Land | Improvement |
|---|---|---|---|---|
| 2024 | $11,554 | $164,131 | $37,466 | $126,665 |
| 2023 | $11,412 | $159,723 | $36,460 | $123,263 |
| 2022 | $11,412 | $155,065 | $35,756 | $119,309 |
| 2021 | $11,041 | $151,092 | $34,840 | $116,252 |
| 2020 | $10,720 | $151,092 | $34,840 | $116,252 |
| 2019 | $10,553 | $149,774 | $34,536 | $115,238 |
| 2018 | $10,538 | $151,968 | $37,150 | $114,818 |
| 2017 | $10,449 | $150,136 | $36,702 | $113,434 |
| 2016 | $10,267 | $142,406 | $35,540 | $106,866 |
| 2015 | $10,024 | $135,638 | $33,851 | $101,787 |
| 2014 | $9,231 | $126,675 | $37,115 | $89,560 |
| 2012 | $9,609 | $126,941 | $37,193 | $89,748 |
Source: Public Records
Map
Nearby Homes
- 21410 W York Ct
- 20420 Rand Rd
- 21282 W South Boschome Cir
- 20406 Rand Rd
- 20412 N Rand Rd
- 20481 N Audrey Ln
- 20641 N Weatherstone Rd
- 21946 W Tori Ln
- 21061 N Andover Rd
- 21947 W Tori Ln
- 22077 W Casa Bella View
- 22079 W Casa Bella View
- 22106 W Casa Bella View
- 22110 W Casa Bella View
- 22112 W Casa Bella View
- 22118 W Casa Bella View
- 22145 W White Pine Rd
- 20678 N Oliver Ct
- 20688 N Oliver Ct
- 505 Rue Chamonix
- 20862 N Buffalo Run St
- 20888 N Buffalo Run
- 20836 N Buffalo Run
- 20818 N Buffalo Run Unit 3
- 20875 N Buffalo Run
- 20813 N Buffalo Run
- 20772 N Buffalo Run
- 21560 W Long Grove Rd
- 20956 N Buffalo Run
- 21379 W York Ct
- 20982 N Buffalo Run
- 20982 N Buffalo Run St
- 20726 N Buffalo Run
- 21345 W York Ct
- 21482 W Long Grove Rd
- 21362 W Long Grove Rd
- 21451 W Oak Trail
- 21339 W York Ct
- 21324 W Long Grove Rd
- 21349 W Willow Dr