Estimated Value: $149,000 - $180,000
3
Beds
2
Baths
1,350
Sq Ft
$121/Sq Ft
Est. Value
About This Home
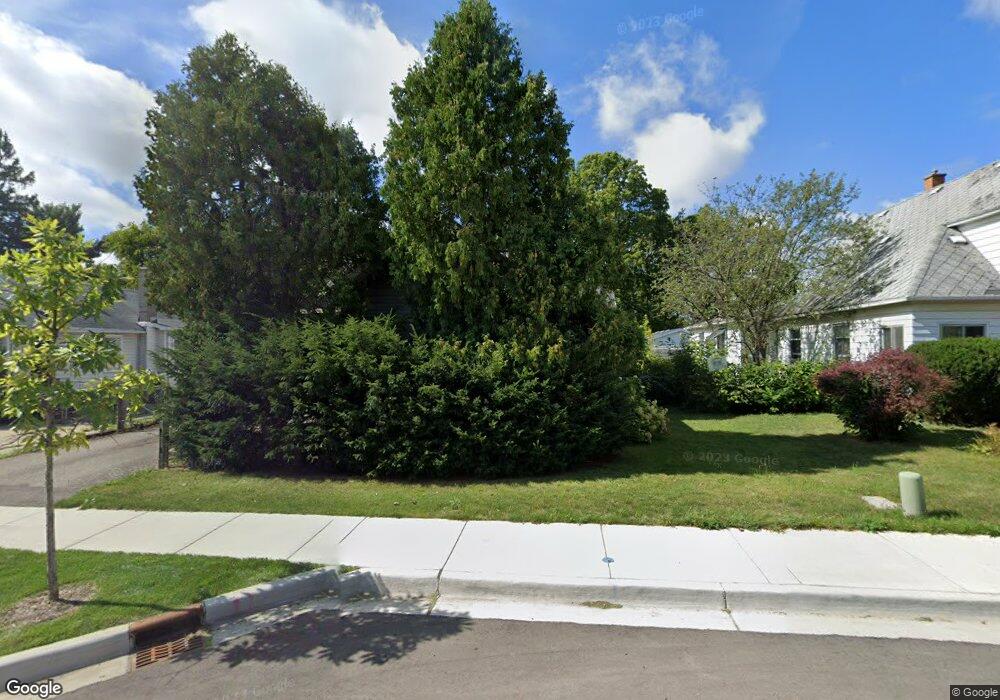
This home is located at 2087 Cedar St, Holt, MI 48842 and is currently estimated at $162,825, approximately $120 per square foot. 2087 Cedar St is a home located in Ingham County with nearby schools including Wilcox Elementary School, Hope Middle School, and Holt Junior High School.
Ownership History
Date
Name
Owned For
Owner Type
Purchase Details
Closed on
Jan 6, 2022
Sold by
Gimore M Scott
Bought by
Morgan Joseph
Current Estimated Value
Home Financials for this Owner
Home Financials are based on the most recent Mortgage that was taken out on this home.
Original Mortgage
$91,200
Outstanding Balance
$83,891
Interest Rate
3.12%
Mortgage Type
New Conventional
Estimated Equity
$78,934
Purchase Details
Closed on
Aug 17, 2020
Sold by
Drier Betty and Drier Arthur
Bought by
Gilmore M Scott
Purchase Details
Closed on
Jan 12, 2011
Sold by
Odom Ginger M
Bought by
Every James R
Create a Home Valuation Report for This Property
The Home Valuation Report is an in-depth analysis detailing your home's value as well as a comparison with similar homes in the area
Home Values in the Area
Average Home Value in this Area
Purchase History
| Date | Buyer | Sale Price | Title Company |
|---|---|---|---|
| Morgan Joseph | $114,000 | Transnation Title Agency | |
| Gilmore M Scott | $62,500 | Transnation Title Agency | |
| Every James R | -- | None Available |
Source: Public Records
Mortgage History
| Date | Status | Borrower | Loan Amount |
|---|---|---|---|
| Open | Morgan Joseph | $91,200 |
Source: Public Records
Tax History Compared to Growth
Tax History
| Year | Tax Paid | Tax Assessment Tax Assessment Total Assessment is a certain percentage of the fair market value that is determined by local assessors to be the total taxable value of land and additions on the property. | Land | Improvement |
|---|---|---|---|---|
| 2025 | $3,563 | $76,800 | $23,600 | $53,200 |
| 2024 | $8 | $71,500 | $20,400 | $51,100 |
| 2023 | $3,314 | $65,100 | $14,800 | $50,300 |
| 2022 | $3,178 | $57,600 | $14,800 | $42,800 |
| 2021 | $3,916 | $52,400 | $11,300 | $41,100 |
| 2020 | $2,331 | $50,100 | $11,300 | $38,800 |
| 2019 | $2,291 | $46,700 | $10,400 | $36,300 |
| 2018 | $2,279 | $44,400 | $10,400 | $34,000 |
| 2017 | $2,032 | $44,400 | $10,400 | $34,000 |
| 2016 | $2,110 | $46,200 | $9,700 | $36,500 |
| 2015 | $2,028 | $42,300 | $19,312 | $22,988 |
| 2014 | $2,028 | $41,100 | $19,312 | $21,788 |
Source: Public Records
Map
Nearby Homes
- 4445 North St
- 2201 Bertha St
- 4304 Bond Ave
- 2216 Coolridge Rd
- 4282 Woodworth Ave
- 2058 Park Ln
- 1947 Maple St
- 1942 Walnut St
- 4245 Holt Rd
- 4592 Holt Rd
- 1920 Schoolcraft St
- 1906 Hall St
- 0 Aurelius Rd Unit 282659
- 4615 Tolland Ave
- 4641 Tolland Ave
- 4662 Tolland Ave
- 4348 Norway St
- 2545 Limerick Cir Unit 8
- 7011 Aurelius Rd
- 2564 Winterberry St